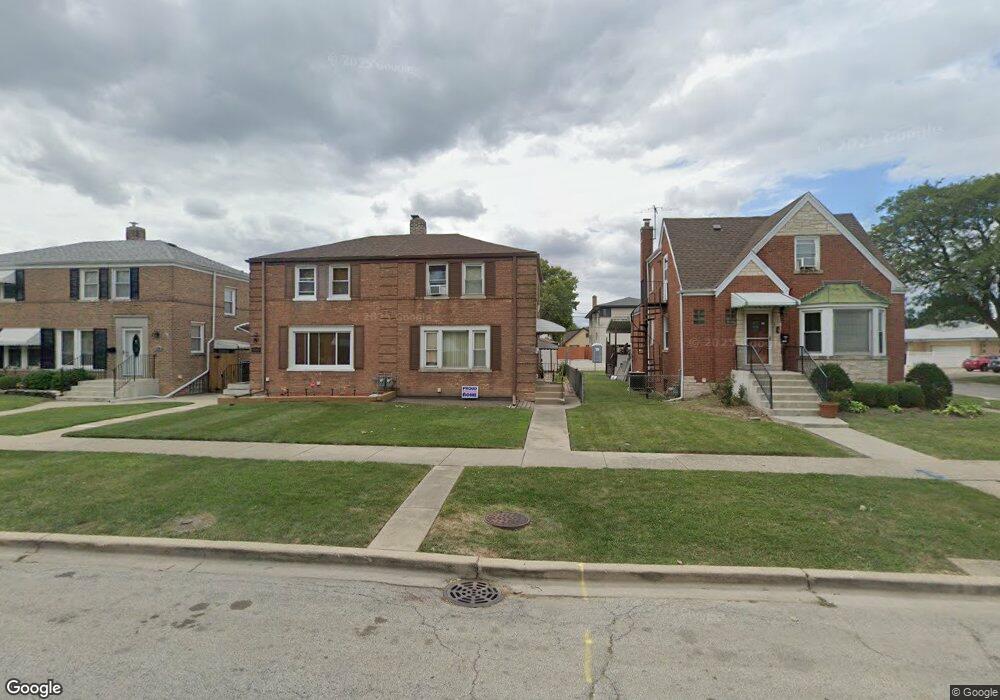
1544 N 20th Ave Melrose Park, IL 60160
Estimated Value: $244,000 - $292,000
2
Beds
1
Bath
938
Sq Ft
$292/Sq Ft
Est. Value
About This Home
This home is located at 1544 N 20th Ave, Melrose Park, IL 60160 and is currently estimated at $273,863, approximately $291 per square foot. 1544 N 20th Ave is a home located in Cook County with nearby schools including Melrose Park Elementary School, Stevenson Middle School, and Proviso East High School.
Ownership History
Date
Name
Owned For
Owner Type
Purchase Details
Closed on
Nov 1, 2005
Sold by
Lopez Jose G and Lopez Maria I
Bought by
Shambo Michele A
Current Estimated Value
Home Financials for this Owner
Home Financials are based on the most recent Mortgage that was taken out on this home.
Original Mortgage
$160,800
Outstanding Balance
$87,782
Interest Rate
5.98%
Mortgage Type
Fannie Mae Freddie Mac
Estimated Equity
$186,081
Purchase Details
Closed on
Jan 14, 2000
Sold by
Nobile Vincenta and Nobile Kimberly Ann
Bought by
Lopez Jose G and Lopez Maria I
Home Financials for this Owner
Home Financials are based on the most recent Mortgage that was taken out on this home.
Original Mortgage
$116,500
Interest Rate
11.1%
Purchase Details
Closed on
Aug 17, 1995
Sold by
Nobile Vincent A
Bought by
Nobile Vincent A and Nobile Kimberly Ann
Create a Home Valuation Report for This Property
The Home Valuation Report is an in-depth analysis detailing your home's value as well as a comparison with similar homes in the area
Home Values in the Area
Average Home Value in this Area
Purchase History
| Date | Buyer | Sale Price | Title Company |
|---|---|---|---|
| Shambo Michele A | $201,000 | -- | |
| Lopez Jose G | $116,500 | -- | |
| Nobile Vincent A | -- | -- |
Source: Public Records
Mortgage History
| Date | Status | Borrower | Loan Amount |
|---|---|---|---|
| Open | Shambo Michele A | $160,800 | |
| Previous Owner | Lopez Jose G | $116,500 |
Source: Public Records
Tax History Compared to Growth
Tax History
| Year | Tax Paid | Tax Assessment Tax Assessment Total Assessment is a certain percentage of the fair market value that is determined by local assessors to be the total taxable value of land and additions on the property. | Land | Improvement |
|---|---|---|---|---|
| 2024 | $4,855 | $22,000 | $2,861 | $19,139 |
| 2023 | $4,411 | $22,000 | $2,861 | $19,139 |
| 2022 | $4,411 | $17,734 | $2,474 | $15,260 |
| 2021 | $4,507 | $17,734 | $2,474 | $15,260 |
| 2020 | $4,450 | $17,734 | $2,474 | $15,260 |
| 2019 | $3,953 | $15,622 | $2,242 | $13,380 |
| 2018 | $3,936 | $15,622 | $2,242 | $13,380 |
| 2017 | $3,867 | $15,622 | $2,242 | $13,380 |
| 2016 | $2,783 | $11,180 | $2,010 | $9,170 |
| 2015 | $2,700 | $11,180 | $2,010 | $9,170 |
| 2014 | $2,633 | $11,180 | $2,010 | $9,170 |
| 2013 | $2,782 | $12,540 | $2,010 | $10,530 |
Source: Public Records
Map
Nearby Homes
- 1540 N 21st Ave
- 1514 N 22nd Ave
- 1634 N 22nd Ave
- 1724 N 19th Ave
- 1531 N 24th Ave
- 1630 N 15th Ave
- 1710 N 23rd Ave
- 1418 N 24th Ave
- 1718 N 15th Ave
- 1815 N 22nd Ave
- 1209 Helen Dr
- 1822 N 23rd Ave
- 1832 N 23rd Ave
- 1202 Elsie Dr
- 1616 N 12th Ave
- 805 N 22nd Ave
- 923 Division St
- 1933 N 18th Ave
- 1940 N 19th Ave
- 1200 N 11th Ave
- 1542 N 20th Ave
- 1542 N 20th Ave Unit 1S
- 1548 N 20th Ave
- 1540 N 20th Ave
- 1538 N 20th Ave
- 1536 N 20th Ave
- 1532 N 20th Ave
- 1541 N 21st Ave
- 1547 N 21st Ave
- 1543 N 20th Ave
- 1530 N 20th Ave
- 1539 N 21st Ave
- 1541 N 20th Ave
- 1539 N 20th Ave
- 1535 N 20th Ave
- 1528 N 20th Ave
- 1600 N 20th Ave
- 1600 N 20th Ave
- 1537 N 20th Ave
- 1537 N 21st Ave