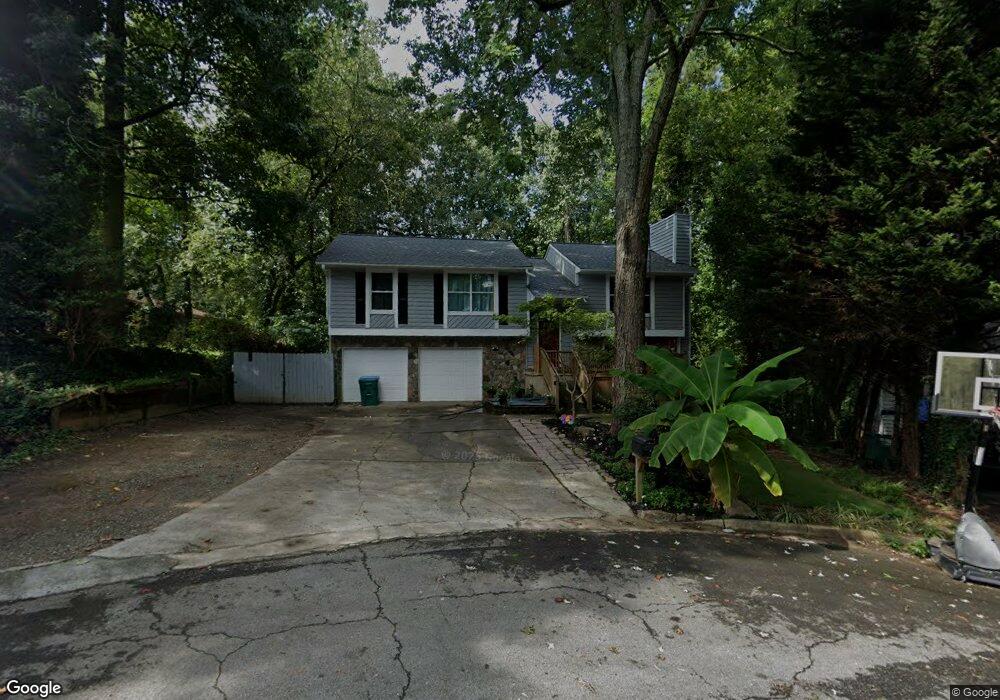
1544 Squire Ct Unit 3 Norcross, GA 30093
Estimated Value: $313,000 - $358,000
3
Beds
2
Baths
1,368
Sq Ft
$248/Sq Ft
Est. Value
About This Home
This home is located at 1544 Squire Ct Unit 3, Norcross, GA 30093 and is currently estimated at $339,250, approximately $247 per square foot. 1544 Squire Ct Unit 3 is a home located in Gwinnett County with nearby schools including Meadowcreek Elementary School, Louise Radloff Middle School, and Meadowcreek High School.
Ownership History
Date
Name
Owned For
Owner Type
Purchase Details
Closed on
Sep 30, 2022
Sold by
Violente Genara
Bought by
Violante Angelica and Galindo Luis
Current Estimated Value
Purchase Details
Closed on
Nov 22, 2019
Sold by
Violante Genara
Bought by
Violante Genara and Violente Angelica
Purchase Details
Closed on
Dec 12, 2002
Sold by
Buruca Juan C and Buruca Ines
Bought by
Violante Genara
Home Financials for this Owner
Home Financials are based on the most recent Mortgage that was taken out on this home.
Original Mortgage
$137,250
Interest Rate
5.92%
Mortgage Type
New Conventional
Purchase Details
Closed on
Jun 23, 2000
Sold by
Clegg Eleanor L
Bought by
Buruca Juan C and Buruca Ines
Home Financials for this Owner
Home Financials are based on the most recent Mortgage that was taken out on this home.
Original Mortgage
$116,800
Interest Rate
8.54%
Mortgage Type
FHA
Create a Home Valuation Report for This Property
The Home Valuation Report is an in-depth analysis detailing your home's value as well as a comparison with similar homes in the area
Home Values in the Area
Average Home Value in this Area
Purchase History
| Date | Buyer | Sale Price | Title Company |
|---|---|---|---|
| Violante Angelica | -- | -- | |
| Violante Genara | -- | -- | |
| Violante Genara | -- | -- | |
| Violante Genara | $141,500 | -- | |
| Buruca Juan C | $116,900 | -- |
Source: Public Records
Mortgage History
| Date | Status | Borrower | Loan Amount |
|---|---|---|---|
| Previous Owner | Violante Genara | $137,250 | |
| Previous Owner | Buruca Juan C | $116,800 |
Source: Public Records
Tax History Compared to Growth
Tax History
| Year | Tax Paid | Tax Assessment Tax Assessment Total Assessment is a certain percentage of the fair market value that is determined by local assessors to be the total taxable value of land and additions on the property. | Land | Improvement |
|---|---|---|---|---|
| 2025 | $5,276 | $140,160 | $21,120 | $119,040 |
| 2024 | $5,061 | $132,560 | $21,120 | $111,440 |
| 2023 | $5,061 | $118,520 | $23,200 | $95,320 |
| 2022 | $3,958 | $102,520 | $14,400 | $88,120 |
| 2021 | $3,028 | $75,280 | $14,400 | $60,880 |
| 2020 | $3,044 | $75,280 | $14,400 | $60,880 |
| 2019 | $2,452 | $61,720 | $11,200 | $50,520 |
| 2018 | $2,450 | $61,720 | $11,200 | $50,520 |
| 2016 | $1,995 | $48,240 | $8,800 | $39,440 |
| 2015 | $1,668 | $38,400 | $6,400 | $32,000 |
| 2014 | -- | $38,400 | $6,400 | $32,000 |
Source: Public Records
Map
Nearby Homes
- 5341 Woodbin Dr
- 1461 Silver Lake Dr
- 1413 Silver Lake Dr
- 1637 Roman Point Dr
- 1437 Roman Point Dr
- 1534 Cove Creek Cir
- 1620 Cove Creek Cir Unit 304
- 5590 Stonewood Ct
- 897 Six Oaks Cir Unit B
- 936 Six Oaks Cir Unit B
- 5375 Goshen Springs Rd
- 5605 Rock Place Ct
- 1133 Sandune Dr
- 5665 Terremont Cir
- 1353 Harbins Ridge Dr Unit 36
- 1013 Sandune Dr
- 5719 Singlebriar Ct
- 5345 Seattle Slew Ct Unit 3
- 0 Squire Ct Unit 7242026
- 0 Squire Ct
- 1601 Kings Ridge Dr
- 1564 Squire Ct Unit 3
- 1591 Kings Ridge Dr Unit 3
- 1553 Squire Ct
- 1611 Kings Ridge Dr
- 1543 Squire Ct
- 5311 Woodbin Dr Unit 3
- 5332 Woodbin Dr
- 5342 Woodbin Dr Unit 3
- 5322 Woodbin Dr
- 5301 Woodbin Dr
- 5352 Woodbin Dr
- 5312 Woodbin Dr
- 1602 Kings Ridge Dr
- 1592 Kings Ridge Dr
- 1612 Kings Ridge Dr
- 1582 Kings Ridge Dr NW
- 1582 Kings Ridge Dr