Estimated Value: $649,000 - $794,000
3
Beds
1
Bath
330
Sq Ft
$2,197/Sq Ft
Est. Value
About This Home
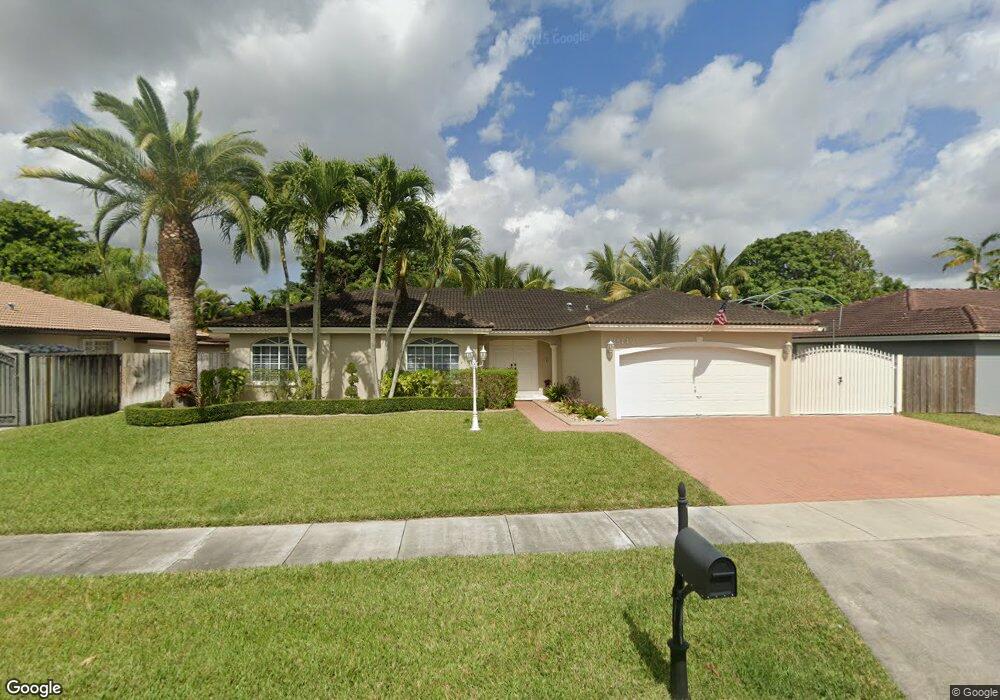
This home is located at 15449 SW 168th Terrace Unit 1, Miami, FL 33187 and is currently estimated at $724,968, approximately $2,196 per square foot. 15449 SW 168th Terrace Unit 1 is a home located in Miami-Dade County with nearby schools including Jorge Mas Canosa Middle School, Arthur And Polly Mays Conservatory Of The Arts, and Robert Morgan Educational Center.
Ownership History
Date
Name
Owned For
Owner Type
Purchase Details
Closed on
Jan 29, 2018
Sold by
Averhoff Albert and Averhoff Lilian L
Bought by
Lugo Jaime and Lugo Arletty A
Current Estimated Value
Home Financials for this Owner
Home Financials are based on the most recent Mortgage that was taken out on this home.
Original Mortgage
$337,250
Outstanding Balance
$285,261
Interest Rate
3.94%
Mortgage Type
New Conventional
Estimated Equity
$439,707
Purchase Details
Closed on
Jan 8, 1998
Sold by
Albert and Averhoff Lillian L
Bought by
Averhoff Albert and Averhoff Lillian L
Purchase Details
Closed on
May 7, 1997
Sold by
Caribe Homes Corp
Bought by
Averhoff Albert and Columbie Lillian L
Home Financials for this Owner
Home Financials are based on the most recent Mortgage that was taken out on this home.
Original Mortgage
$110,000
Interest Rate
7.98%
Mortgage Type
New Conventional
Create a Home Valuation Report for This Property
The Home Valuation Report is an in-depth analysis detailing your home's value as well as a comparison with similar homes in the area
Home Values in the Area
Average Home Value in this Area
Purchase History
| Date | Buyer | Sale Price | Title Company |
|---|---|---|---|
| Lugo Jaime | $355,000 | Express Title Services Group | |
| Averhoff Albert | $100 | -- | |
| Averhoff Albert | $144,600 | -- |
Source: Public Records
Mortgage History
| Date | Status | Borrower | Loan Amount |
|---|---|---|---|
| Open | Lugo Jaime | $337,250 | |
| Previous Owner | Averhoff Albert | $110,000 |
Source: Public Records
Tax History Compared to Growth
Tax History
| Year | Tax Paid | Tax Assessment Tax Assessment Total Assessment is a certain percentage of the fair market value that is determined by local assessors to be the total taxable value of land and additions on the property. | Land | Improvement |
|---|---|---|---|---|
| 2025 | $6,069 | $360,655 | -- | -- |
| 2024 | $5,779 | $350,491 | -- | -- |
| 2023 | $5,779 | $340,283 | $0 | $0 |
| 2022 | $5,566 | $330,372 | $0 | $0 |
| 2021 | $5,530 | $320,750 | $0 | $0 |
| 2020 | $5,469 | $316,322 | $0 | $0 |
| 2019 | $5,354 | $309,211 | $109,725 | $199,486 |
| 2018 | $5,396 | $281,991 | $94,050 | $187,941 |
| 2017 | $5,211 | $254,136 | $0 | $0 |
| 2016 | $4,844 | $231,033 | $0 | $0 |
| 2015 | $4,517 | $210,030 | $0 | $0 |
| 2014 | -- | $190,937 | $0 | $0 |
Source: Public Records
Map
Nearby Homes
- 15518 SW 168th Terrace
- 15461 SW 173rd Ln
- 15451 SW 173rd Ln
- 15305 SW 173rd St
- 17473 SW 153rd Path
- 15282 SW 173rd Ln
- 15274 SW 173rd Ln
- 16137 SW 155th Ave
- 15263 SW 162nd St
- 17650 SW 154th Place
- 15460 SW 176th Ln
- SW 39 ST SW 162 St
- 14931 SW 168th Terrace
- 15400 SW 176th Ln
- 14940 SW 164th Terrace
- 15340 SW 176th Ln
- 15104 SW 176th St
- 14862 SW 169th Ln
- 15201 SW 177th Terrace
- 17833 SW 155th Ct
- 15449 SW 168th Terrace
- 15457 SW 168th Terrace
- 15441 SW 168th Terrace
- 15480 SW 168th St
- 15500 SW 168th St
- 15450 SW 168th Terrace
- 15433 SW 168th Terrace
- 15517 SW 168th Terrace
- 15458 SW 168th Terrace
- 15442 SW 168th Terrace
- 15440 SW 168th St
- 15434 SW 168th Terrace
- 15540 SW 168th St
- 15525 SW 168th Terrace
- 15425 SW 168th Terrace
- 15451 SW 169th Ln
- 15459 SW 169th Ln
- 15443 SW 169th Ln
- 15526 SW 168th Terrace
- 15426 SW 168th Terrace Unit 2