1545 Cokers Chapel Rd Ball Ground, GA 30107
Estimated Value: $399,037 - $492,000
3
Beds
1
Bath
1,144
Sq Ft
$386/Sq Ft
Est. Value
About This Home
This home is located at 1545 Cokers Chapel Rd, Ball Ground, GA 30107 and is currently estimated at $441,509, approximately $385 per square foot. 1545 Cokers Chapel Rd is a home located in Cherokee County with nearby schools including Macedonia Elementary School, Creekland Middle School, and Creekview High School.
Ownership History
Date
Name
Owned For
Owner Type
Purchase Details
Closed on
Jan 24, 2017
Sold by
Dacosta Lori Wyatt
Bought by
Mooney Heather E
Current Estimated Value
Home Financials for this Owner
Home Financials are based on the most recent Mortgage that was taken out on this home.
Original Mortgage
$119,000
Outstanding Balance
$98,856
Interest Rate
4.32%
Mortgage Type
New Conventional
Estimated Equity
$342,653
Purchase Details
Closed on
Mar 26, 2008
Sold by
Wyatt Lori L
Bought by
Dacosta Lori W
Home Financials for this Owner
Home Financials are based on the most recent Mortgage that was taken out on this home.
Original Mortgage
$153,600
Interest Rate
6.22%
Mortgage Type
New Conventional
Purchase Details
Closed on
Aug 31, 2001
Sold by
Jones Richard L and Jones Wanda K
Bought by
Wyatt Lori L
Home Financials for this Owner
Home Financials are based on the most recent Mortgage that was taken out on this home.
Original Mortgage
$153,400
Interest Rate
6.85%
Mortgage Type
New Conventional
Create a Home Valuation Report for This Property
The Home Valuation Report is an in-depth analysis detailing your home's value as well as a comparison with similar homes in the area
Home Values in the Area
Average Home Value in this Area
Purchase History
| Date | Buyer | Sale Price | Title Company |
|---|---|---|---|
| Mooney Heather E | $175,000 | -- | |
| Dacosta Lori W | -- | -- | |
| Wyatt Lori L | $161,500 | -- |
Source: Public Records
Mortgage History
| Date | Status | Borrower | Loan Amount |
|---|---|---|---|
| Open | Mooney Heather E | $119,000 | |
| Previous Owner | Dacosta Lori W | $153,600 | |
| Previous Owner | Wyatt Lori L | $153,400 |
Source: Public Records
Tax History Compared to Growth
Tax History
| Year | Tax Paid | Tax Assessment Tax Assessment Total Assessment is a certain percentage of the fair market value that is determined by local assessors to be the total taxable value of land and additions on the property. | Land | Improvement |
|---|---|---|---|---|
| 2024 | $2,716 | $116,804 | $59,160 | $57,644 |
| 2023 | $2,085 | $107,464 | $48,960 | $58,504 |
| 2022 | $2,077 | $85,248 | $46,920 | $38,328 |
| 2021 | $1,910 | $70,700 | $40,800 | $29,900 |
| 2020 | $1,920 | $71,104 | $40,800 | $30,304 |
| 2019 | $1,771 | $64,680 | $40,800 | $23,880 |
| 2018 | $1,756 | $63,680 | $40,800 | $22,880 |
| 2017 | $1,844 | $160,000 | $40,800 | $23,200 |
| 2016 | $1,697 | $145,700 | $36,720 | $21,560 |
| 2015 | $1,563 | $132,900 | $31,280 | $21,880 |
| 2014 | $1,389 | $117,900 | $25,840 | $21,320 |
Source: Public Records
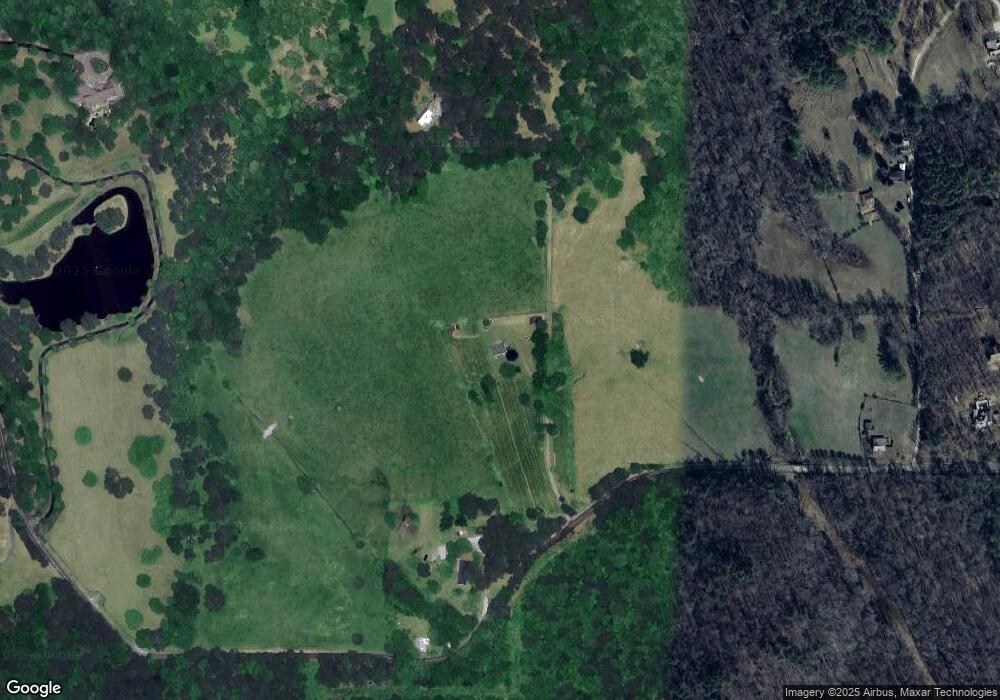
Map
Nearby Homes
- 274 Etowah Downs Ct
- 241 Wild Turkey Ridge
- 145 Highlands Chase
- 190 Highlands Chase
- 240 Highlands Chase
- 1764 Flatbottom Rd
- 112 Creek Side Way
- 11952 E Cherokee Dr
- 2055 Henry Scott Rd Unit LOT B (3.7 ACRES)
- 2049 Henry Scott Rd-Lot C 2 3 Acres
- 2055
- 2061 Henry Scott Rd-Lot A 2 9 Acres
- 255 Heritage Creek Trail
- 2049 Henry Scott Rd Unit LOT C 2.3 ACRES
- 2061 Henry Scott Rd Unit LOT A 2.9 ACRES
- 251 A Murphy Trail
- 202 Saddlehorn Trail
- 346 Dock Lathem Trail
- 200 Summer Ridge Dr
- 1555 Cokers Chapel Rd
- 1491 Cokers Chapel Rd
- 1 Cokers Chapel Rd
- 0 Cokers Chapel Rd Unit 10211407
- 0 Cokers Chapel Rd Unit 20043049
- 0 Cokers Chapel Rd Unit 988118
- 0 Cokers Chapel Rd Unit 20025062
- 0 Cokers Chapel Rd Unit 7013603
- 0 Cokers Chapel Rd Unit 7373678
- 0 Cokers Chapel Rd Unit 7282509
- 0 Cokers Chapel Rd Unit 8649381
- 0 Cokers Chapel Rd Unit 8519187
- 0 Cokers Chapel Rd Unit 8356870
- 0 Cokers Chapel Rd Unit 8313862
- 0 Cokers Chapel Rd Unit 7259113
- 0 Cokers Chapel Rd Unit 7490046
- 0 Cokers Chapel Rd Unit 7345960
- 0 Cokers Chapel Rd Unit 8510288
- 0 Cokers Chapel Rd Unit 3204169
- 0 Cokers Chapel Rd Unit 7364649