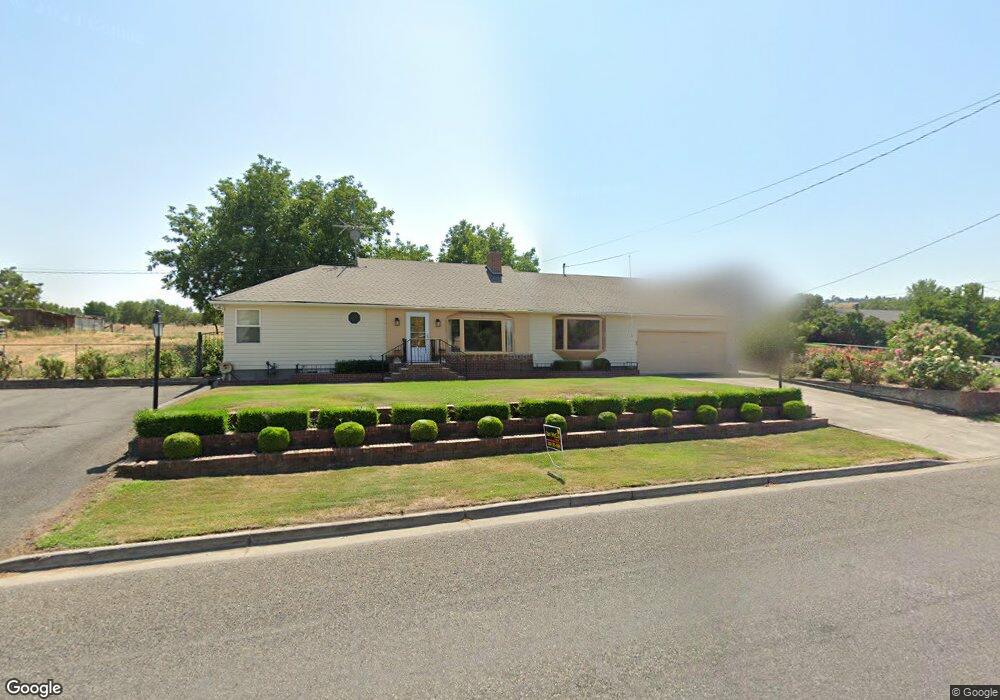
1545 Elm St Clarkston, WA 99403
Estimated Value: $501,000 - $573,770
4
Beds
3
Baths
1,989
Sq Ft
$274/Sq Ft
Est. Value
About This Home
This home is located at 1545 Elm St, Clarkston, WA 99403 and is currently estimated at $545,257, approximately $274 per square foot. 1545 Elm St is a home located in Asotin County with nearby schools including Highland Elementary School, Lincoln Middle School, and Charles Francis Adams High School.
Ownership History
Date
Name
Owned For
Owner Type
Purchase Details
Closed on
Apr 6, 2021
Sold by
Desalme Avril J and Desalme Barbara Charlene
Bought by
Desalme Avril J and Desalme Barbara Charlene
Current Estimated Value
Home Financials for this Owner
Home Financials are based on the most recent Mortgage that was taken out on this home.
Original Mortgage
$290,500
Outstanding Balance
$261,436
Interest Rate
2.8%
Mortgage Type
New Conventional
Estimated Equity
$283,821
Purchase Details
Closed on
Mar 27, 2020
Sold by
Seman Sandra K and Jacobson Susan M
Bought by
Desalme Avril J and Desalme Barbara Charlene
Home Financials for this Owner
Home Financials are based on the most recent Mortgage that was taken out on this home.
Original Mortgage
$280,000
Interest Rate
3.4%
Mortgage Type
New Conventional
Purchase Details
Closed on
Sep 1, 2018
Sold by
Osborne Janet and Flerchinger Jim
Bought by
Wiseman Sandra K and Jacobson Susan M
Create a Home Valuation Report for This Property
The Home Valuation Report is an in-depth analysis detailing your home's value as well as a comparison with similar homes in the area
Home Values in the Area
Average Home Value in this Area
Purchase History
| Date | Buyer | Sale Price | Title Company |
|---|---|---|---|
| Desalme Avril J | -- | Alliance Title Clarkston | |
| Desalme Avril J | $350,000 | Alliance Title & Escrow | |
| Wiseman Sandra K | -- | None Available |
Source: Public Records
Mortgage History
| Date | Status | Borrower | Loan Amount |
|---|---|---|---|
| Open | Desalme Avril J | $290,500 | |
| Closed | Desalme Avril J | $280,000 |
Source: Public Records
Tax History Compared to Growth
Tax History
| Year | Tax Paid | Tax Assessment Tax Assessment Total Assessment is a certain percentage of the fair market value that is determined by local assessors to be the total taxable value of land and additions on the property. | Land | Improvement |
|---|---|---|---|---|
| 2021 | $4,099 | $372,267 | $84,467 | $287,800 |
| 2020 | $3,899 | $344,000 | $118,300 | $225,700 |
| 2019 | $3,402 | $344,000 | $118,300 | $225,700 |
| 2018 | $4,184 | $344,000 | $118,300 | $225,700 |
| 2017 | $3,828 | $344,000 | $118,300 | $225,700 |
| 2016 | $3,828 | $327,200 | $117,000 | $210,200 |
| 2015 | $366 | $319,100 | $117,000 | $202,100 |
| 2013 | $3,721 | $313,200 | $117,000 | $196,200 |
Source: Public Records
Map
Nearby Homes
- 708 16th St
- 841 van Arsdol St
- 1485 Sycamore St
- 1450 & 1454 Elm St
- 922 16th St
- 1039 15th St
- 811 14th St
- 1117 15th St
- 1368 Chestnut St
- 1817 Frederickson Dr
- NNA 13th St
- 1383 Fair St Unit 11
- 1383 Fair St Unit 5
- 1383 Fair St Unit 7
- 1522 Highland Ave
- 940 Coulter Ln
- LOT 10 Bennett Hill Dr
- 1962 Golfview Dr
- 418 & 422 13th St
- 1664 Bennett Hill Dr