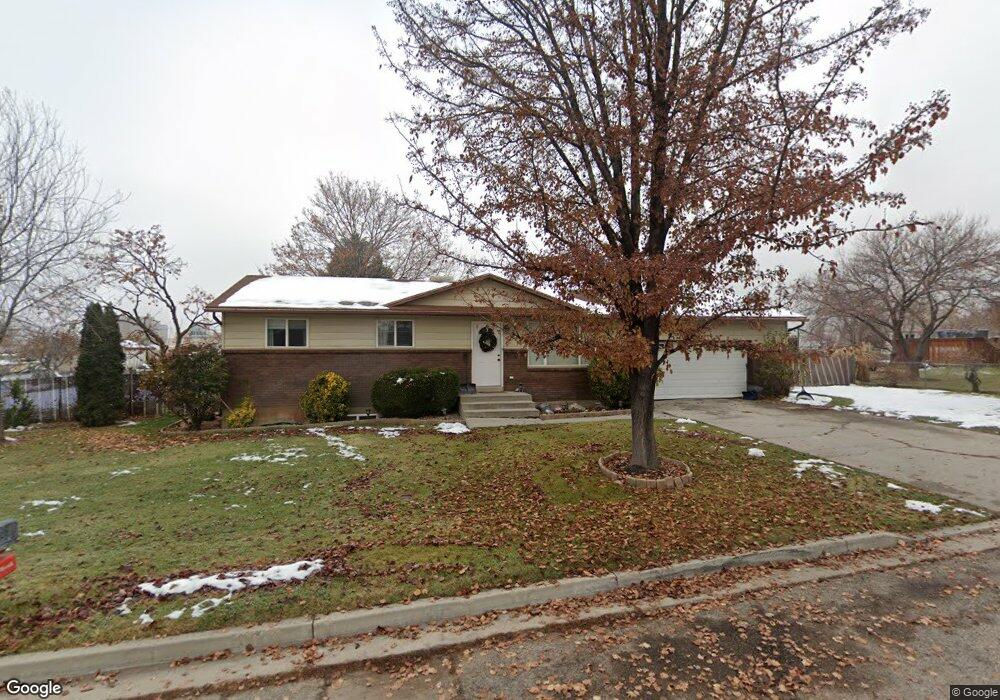
1545 N 1520 W Pleasant Grove, UT 84062
Estimated Value: $554,000 - $616,000
3
Beds
2
Baths
1,080
Sq Ft
$534/Sq Ft
Est. Value
About This Home
This home is located at 1545 N 1520 W, Pleasant Grove, UT 84062 and is currently estimated at $576,331, approximately $533 per square foot. 1545 N 1520 W is a home located in Utah County with nearby schools including Mount Mahogany School, Pleasant Grove Junior High School, and Pleasant Grove High School.
Ownership History
Date
Name
Owned For
Owner Type
Purchase Details
Closed on
Aug 9, 2001
Sold by
Syme Leslie J and Syme Gaylene
Bought by
Syme Gaylene and Syme Leslie J
Current Estimated Value
Home Financials for this Owner
Home Financials are based on the most recent Mortgage that was taken out on this home.
Original Mortgage
$143,500
Interest Rate
7.1%
Purchase Details
Closed on
Mar 16, 2000
Sold by
Bawden Merrill R and Bawden Laura C
Bought by
Syme Leslie J and Syme Gaylene
Home Financials for this Owner
Home Financials are based on the most recent Mortgage that was taken out on this home.
Original Mortgage
$142,500
Interest Rate
8.21%
Purchase Details
Closed on
Jul 5, 1998
Sold by
Draper Boyd E and Draper Linda B
Bought by
Bawden Merrill R and Bawden Laura C
Home Financials for this Owner
Home Financials are based on the most recent Mortgage that was taken out on this home.
Original Mortgage
$90,000
Interest Rate
6.95%
Create a Home Valuation Report for This Property
The Home Valuation Report is an in-depth analysis detailing your home's value as well as a comparison with similar homes in the area
Home Values in the Area
Average Home Value in this Area
Purchase History
| Date | Buyer | Sale Price | Title Company |
|---|---|---|---|
| Syme Gaylene | -- | Mountain West Title Co | |
| Syme Leslie J | -- | Mountain West Title Co | |
| Bawden Merrill R | -- | -- |
Source: Public Records
Mortgage History
| Date | Status | Borrower | Loan Amount |
|---|---|---|---|
| Closed | Syme Gaylene | $143,500 | |
| Closed | Syme Leslie J | $142,500 | |
| Previous Owner | Bawden Merrill R | $90,000 |
Source: Public Records
Tax History Compared to Growth
Tax History
| Year | Tax Paid | Tax Assessment Tax Assessment Total Assessment is a certain percentage of the fair market value that is determined by local assessors to be the total taxable value of land and additions on the property. | Land | Improvement |
|---|---|---|---|---|
| 2025 | $2,273 | $286,055 | $292,300 | $227,800 |
| 2024 | $2,273 | $265,265 | $0 | $0 |
| 2023 | $2,169 | $264,990 | $0 | $0 |
| 2022 | $2,427 | $295,020 | $0 | $0 |
| 2021 | $2,032 | $376,200 | $183,500 | $192,700 |
| 2020 | $1,886 | $342,200 | $163,800 | $178,400 |
| 2019 | $1,751 | $328,600 | $155,200 | $173,400 |
| 2018 | $1,680 | $298,100 | $146,600 | $151,500 |
| 2017 | $1,635 | $154,440 | $0 | $0 |
| 2016 | $1,364 | $124,410 | $0 | $0 |
| 2015 | $1,321 | $114,070 | $0 | $0 |
| 2014 | $1,245 | $106,480 | $0 | $0 |
Source: Public Records
Map
Nearby Homes
- 1320 W 1340 N
- 1171 N 1430 W
- 1141 E 50 N
- Lytham Plan at Grove Acres
- 1498 W 1060 N Unit 5
- 1096 N 1420 St W Unit 27
- 1065 N 1420 W
- 1541 W 1060 N
- 1515 W 1010 St N
- 1879 W 1100 N
- 1491 W 1010 N
- 1443 W 1010 N
- 980 W 1800 N
- 1897 N 900 W
- 2254 N 1560 W
- 909 W 1180 N
- 759 W 930 N Unit 502
- 708 W 930 N Unit 505
- 734 W 930 N Unit 506
- Konlee Plan at Makin Dreams
- 1505 N 1520 W
- 1585 N 1520 W
- 1540 N 1520 W
- 1506 N 1520 W
- 1586 N 1520 W
- 1465 N 1520 W
- 1464 N 1520 W
- 1645 N 1520 W
- 1644 N 1520 W
- 1427 W 1620 N Unit 102
- 1468 W 1440 N
- 1468 W 1440 N Unit 1
- 1504 N 1430 W
- 1504 N 1430 W Unit 106
- 1631 Leslie Cir
- 1338 W 1620 N
- 1407 N 1520 W
- 1685 N 1520 W
- 1408 N 1520 W
- 1686 N 1520 W