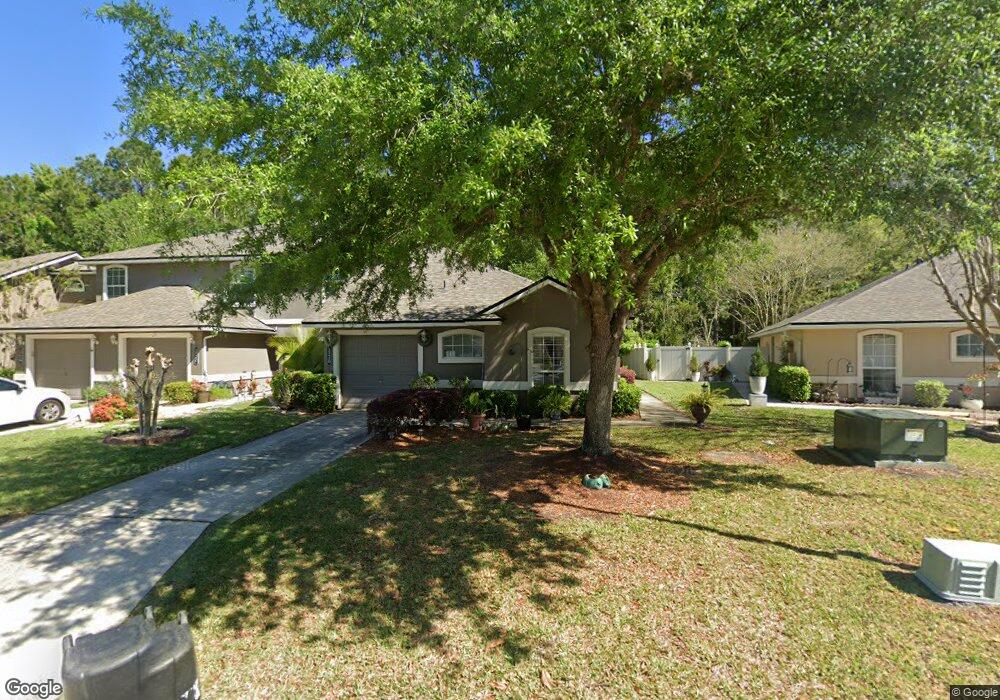
1545 Vineland Cir Fleming Island, FL 32003
Estimated Value: $240,697 - $290,000
3
Beds
3
Baths
1,460
Sq Ft
$180/Sq Ft
Est. Value
About This Home
This home is located at 1545 Vineland Cir, Fleming Island, FL 32003 and is currently estimated at $263,174, approximately $180 per square foot. 1545 Vineland Cir is a home located in Clay County with nearby schools including Thunderbolt Elementary School, Fleming Island High School, and Green Cove Springs Junior High School.
Ownership History
Date
Name
Owned For
Owner Type
Purchase Details
Closed on
Feb 12, 2019
Sold by
Filson Leila and Filson Samuel
Bought by
Filson Home Rentals Llc
Current Estimated Value
Purchase Details
Closed on
Mar 2, 2018
Sold by
Sailers Leila and Filson Leila
Bought by
Filson Leila and Filson Samuel
Purchase Details
Closed on
Jan 3, 2008
Sold by
Good Mark A
Bought by
Sailers Leila
Home Financials for this Owner
Home Financials are based on the most recent Mortgage that was taken out on this home.
Original Mortgage
$127,900
Interest Rate
5.86%
Mortgage Type
Purchase Money Mortgage
Purchase Details
Closed on
May 2, 2007
Sold by
Good Mark A
Bought by
Good Mark A
Purchase Details
Closed on
Nov 19, 2004
Sold by
D R Horton Inc Jacksonville
Bought by
Good Mark A
Home Financials for this Owner
Home Financials are based on the most recent Mortgage that was taken out on this home.
Original Mortgage
$102,934
Interest Rate
5.6%
Mortgage Type
Stand Alone First
Create a Home Valuation Report for This Property
The Home Valuation Report is an in-depth analysis detailing your home's value as well as a comparison with similar homes in the area
Home Values in the Area
Average Home Value in this Area
Purchase History
| Date | Buyer | Sale Price | Title Company |
|---|---|---|---|
| Filson Home Rentals Llc | -- | Attorney | |
| Filson Leila | -- | Attorney | |
| Sailers Leila | -- | Five Star Title Services Llc | |
| Good Mark A | -- | Attorney | |
| Good Mark A | $138,000 | Dhi Title Of Florida Inc |
Source: Public Records
Mortgage History
| Date | Status | Borrower | Loan Amount |
|---|---|---|---|
| Previous Owner | Sailers Leila | $127,900 | |
| Previous Owner | Good Mark A | $102,934 |
Source: Public Records
Tax History Compared to Growth
Tax History
| Year | Tax Paid | Tax Assessment Tax Assessment Total Assessment is a certain percentage of the fair market value that is determined by local assessors to be the total taxable value of land and additions on the property. | Land | Improvement |
|---|---|---|---|---|
| 2025 | $3,150 | $220,977 | $35,000 | $185,977 |
| 2024 | $4,458 | $216,021 | $35,000 | $181,021 |
| 2023 | $4,458 | $212,744 | $35,000 | $177,744 |
| 2022 | $3,980 | $182,556 | $20,000 | $162,556 |
| 2021 | $3,661 | $154,298 | $20,000 | $134,298 |
| 2020 | $3,505 | $147,650 | $20,000 | $127,650 |
| 2019 | $3,315 | $134,651 | $20,000 | $114,651 |
| 2018 | $1,813 | $85,316 | $0 | $0 |
| 2017 | $1,788 | $83,561 | $0 | $0 |
| 2016 | $1,773 | $81,842 | $0 | $0 |
| 2015 | $1,805 | $81,273 | $0 | $0 |
| 2014 | $1,781 | $80,628 | $0 | $0 |
Source: Public Records
Map
Nearby Homes
- 1835 Green Springs Cir Unit D
- 1810 Green Springs Cir Unit B
- 2549 Whispering Pines Dr
- 2543 Willow Creek Dr
- 2479 Pinehurst Ln
- 1725 River Hills Dr
- 1734 Covington Ln
- 1798 Covington Ln
- 1355 Clay St
- 2506 Willow Creek Dr
- 1276 Floyd St
- 1305 Fairway Village Dr
- 1897 Hickory Trace Dr
- 1886 Hickory Trace Dr
- 2493 Tall Cedars Rd
- 770 Hibernia Rd
- 1807 Chatham Village Dr
- 870 Hibernia Forest Dr
- 1558 Calming Water Dr
- 1000 Fleming St
- 1545 Vineland Cir
- 1545 Vineland Cir Unit D
- 1545 Vineland Cir Unit A
- 1555C Vineland Cir
- 1555B Vineland Cir
- 1545D Vineland Cir
- 1545A Vineland Cir
- 1545C Vineland Cir
- 1535 Vineland Cir
- 1535 Vineland Cir Unit B
- 1535 Vineland Cir Unit c
- 1535C Vineland C Cir Unit C
- 1555A Vineland Cir Unit D
- 1555A Vineland Cir
- 1555 Vineland Cir Unit A
- 1555 Vineland Cir Unit C
- 1555 Vineland Cir Unit D
- 1550E Vineland Cir
- 1550C Vineland Cir
- 1550A Vineland Cir