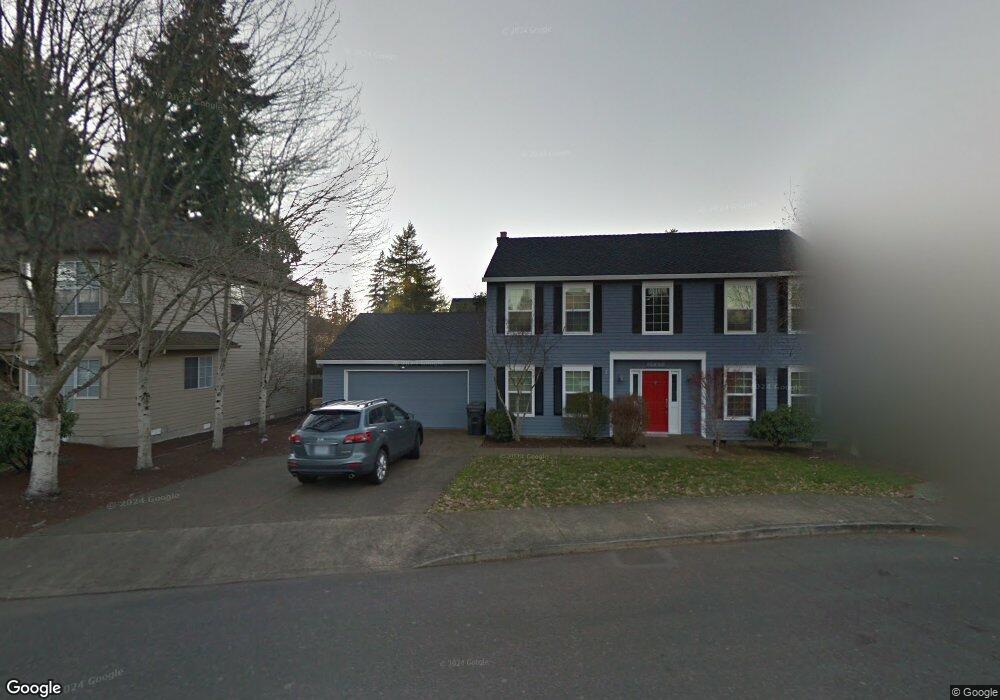
15454 Stephanie Ct Lake Oswego, OR 97035
Lake Forest NeighborhoodEstimated Value: $512,000 - $677,000
3
Beds
3
Baths
1,607
Sq Ft
$348/Sq Ft
Est. Value
About This Home
This home is located at 15454 Stephanie Ct, Lake Oswego, OR 97035 and is currently estimated at $558,520, approximately $347 per square foot. 15454 Stephanie Ct is a home located in Clackamas County with nearby schools including River Grove Elementary School, Lakeridge Middle School, and Lakeridge High School.
Ownership History
Date
Name
Owned For
Owner Type
Purchase Details
Closed on
Aug 26, 2010
Sold by
Standley Pamela
Bought by
Standley Pamela A
Current Estimated Value
Home Financials for this Owner
Home Financials are based on the most recent Mortgage that was taken out on this home.
Original Mortgage
$117,000
Interest Rate
4.52%
Mortgage Type
New Conventional
Purchase Details
Closed on
Jun 10, 2003
Sold by
Peddie Harrison
Bought by
Standley Pamela
Home Financials for this Owner
Home Financials are based on the most recent Mortgage that was taken out on this home.
Original Mortgage
$181,600
Interest Rate
5.61%
Mortgage Type
Purchase Money Mortgage
Purchase Details
Closed on
Oct 25, 2001
Sold by
Bangy Road Townhomes Llc
Bought by
Peddie Harrison
Home Financials for this Owner
Home Financials are based on the most recent Mortgage that was taken out on this home.
Original Mortgage
$160,480
Interest Rate
6.09%
Create a Home Valuation Report for This Property
The Home Valuation Report is an in-depth analysis detailing your home's value as well as a comparison with similar homes in the area
Home Values in the Area
Average Home Value in this Area
Purchase History
| Date | Buyer | Sale Price | Title Company |
|---|---|---|---|
| Standley Pamela A | -- | Wfg Title | |
| Standley Pamela | $227,500 | Ticor Title Insurance Compan | |
| Peddie Harrison | $200,600 | Chicago Title Insurance Co |
Source: Public Records
Mortgage History
| Date | Status | Borrower | Loan Amount |
|---|---|---|---|
| Closed | Standley Pamela A | $117,000 | |
| Closed | Standley Pamela | $181,600 | |
| Previous Owner | Peddie Harrison | $160,480 |
Source: Public Records
Tax History Compared to Growth
Tax History
| Year | Tax Paid | Tax Assessment Tax Assessment Total Assessment is a certain percentage of the fair market value that is determined by local assessors to be the total taxable value of land and additions on the property. | Land | Improvement |
|---|---|---|---|---|
| 2025 | $5,720 | $297,849 | -- | -- |
| 2024 | $5,567 | $289,174 | -- | -- |
| 2023 | $5,567 | $280,752 | $0 | $0 |
| 2022 | $5,244 | $272,575 | $0 | $0 |
| 2021 | $4,843 | $264,636 | $0 | $0 |
| 2020 | $4,721 | $256,929 | $0 | $0 |
| 2019 | $4,605 | $249,446 | $0 | $0 |
| 2018 | $4,379 | $242,181 | $0 | $0 |
| 2017 | $4,226 | $235,127 | $0 | $0 |
| 2016 | $3,847 | $228,279 | $0 | $0 |
| 2015 | $3,680 | $221,630 | $0 | $0 |
| 2014 | $3,638 | $215,175 | $0 | $0 |
Source: Public Records
Map
Nearby Homes
- 15540 Partridge Dr
- 6300 Shakespeare St
- 5835 Carman Dr
- 5767 Baleine St
- 5725 Windfield Loop
- 6290 Carman Dr
- 6290 SW Carman Dr
- 5185 Carman Dr
- 16405 Bonaire Ave
- 16508 Bonaire Ave
- 5010 Park Bluff Place
- 15601 Manchester Dr
- 4992 Park Bluff Place
- 4974 Park Bluff Place
- 16960 Denney Ct
- 7758 SW Bonita Rd
- 7754 SW Bonita Rd
- 16061 Waluga Dr
- 7750 SW Bonita Rd
- 14670 SW 78th Ave
- 15450 Stephanie Ct
- 15446 Stephanie Ct
- 6301 Alyssa Terrace
- 15430 SW Partridge Dr
- 15426 Partridge Dr
- 6290 Alyssa Terrace
- 6305 Alyssa Terrace
- 15434 Stephanie Ct
- 6309 Alyssa Terrace
- 15434 Partridge Dr
- 6215 Burma Rd
- 15422 Partridge Dr
- 15430 Stephanie Ct
- 6313 Alyssa Terrace
- 6310 Alyssa Terrace
- 6317 Alyssa Terrace
- 6255 Burma Rd
- 6255 SW Burma Rd
- 15438 Partridge Dr