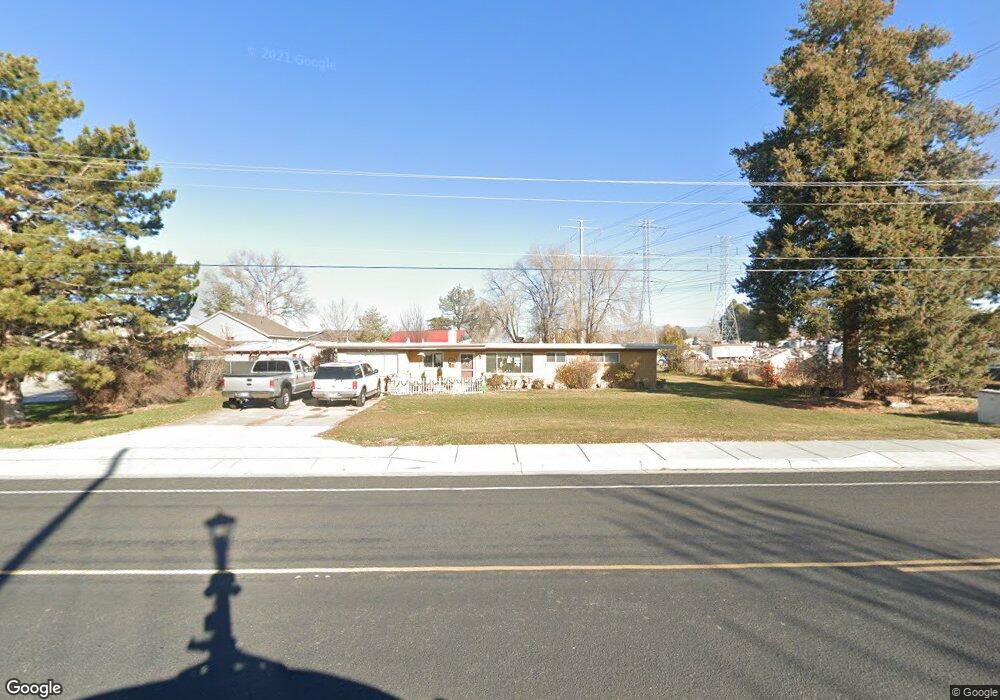
1546 W 300 N Clearfield, UT 84015
Estimated Value: $429,036 - $467,000
3
Beds
2
Baths
1,799
Sq Ft
$249/Sq Ft
Est. Value
About This Home
This home is located at 1546 W 300 N, Clearfield, UT 84015 and is currently estimated at $448,509, approximately $249 per square foot. 1546 W 300 N is a home located in Davis County with nearby schools including Lakeside School, West Point Junior High School, and Syracuse High School.
Ownership History
Date
Name
Owned For
Owner Type
Purchase Details
Closed on
Jul 11, 2012
Sold by
Mckowen Lonnie
Bought by
Mckowen Lonnie
Current Estimated Value
Home Financials for this Owner
Home Financials are based on the most recent Mortgage that was taken out on this home.
Original Mortgage
$137,265
Outstanding Balance
$80,379
Interest Rate
3.75%
Mortgage Type
FHA
Estimated Equity
$368,130
Purchase Details
Closed on
Apr 8, 2009
Sold by
Gardner Beatrice W
Bought by
Mckowen Lonnie
Home Financials for this Owner
Home Financials are based on the most recent Mortgage that was taken out on this home.
Original Mortgage
$142,198
Interest Rate
5.06%
Mortgage Type
FHA
Purchase Details
Closed on
Feb 22, 2002
Sold by
Gardner Beatrice W
Bought by
Bingham Tracy
Home Financials for this Owner
Home Financials are based on the most recent Mortgage that was taken out on this home.
Original Mortgage
$52,250
Interest Rate
6.62%
Create a Home Valuation Report for This Property
The Home Valuation Report is an in-depth analysis detailing your home's value as well as a comparison with similar homes in the area
Home Values in the Area
Average Home Value in this Area
Purchase History
| Date | Buyer | Sale Price | Title Company |
|---|---|---|---|
| Mckowen Lonnie | -- | First American Title | |
| Mckowen Lonnie | -- | Founders Title Co Lay | |
| Bingham Tracy | -- | Backman Stewart Title Servic |
Source: Public Records
Mortgage History
| Date | Status | Borrower | Loan Amount |
|---|---|---|---|
| Open | Mckowen Lonnie | $137,265 | |
| Closed | Mckowen Lonnie | $142,198 | |
| Previous Owner | Bingham Tracy | $52,250 |
Source: Public Records
Tax History Compared to Growth
Tax History
| Year | Tax Paid | Tax Assessment Tax Assessment Total Assessment is a certain percentage of the fair market value that is determined by local assessors to be the total taxable value of land and additions on the property. | Land | Improvement |
|---|---|---|---|---|
| 2025 | $2,271 | $212,851 | $120,302 | $92,549 |
| 2024 | $2,121 | $199,650 | $108,168 | $91,482 |
| 2023 | $1,958 | $339,000 | $143,480 | $195,520 |
| 2022 | $2,066 | $195,800 | $77,163 | $118,637 |
| 2021 | $1,904 | $270,000 | $110,996 | $159,004 |
| 2020 | $1,329 | $186,000 | $94,935 | $91,065 |
| 2019 | $1,261 | $174,000 | $91,599 | $82,401 |
| 2018 | $1,132 | $154,000 | $87,953 | $66,047 |
| 2016 | $990 | $70,841 | $40,222 | $30,619 |
| 2015 | $966 | $65,506 | $40,222 | $25,284 |
| 2014 | $1,159 | $79,681 | $40,346 | $39,335 |
| 2013 | -- | $69,567 | $34,800 | $34,767 |
Source: Public Records
Map
Nearby Homes
- 575 N 1350 W Unit 137
- 1774 W 400 N
- 1652 W 560 N
- 1350 W 300 N Unit 49
- 1350 W 300 N Unit 38
- 1350 W 300 N Unit 29
- 47 N 1750 W
- 563 N 1350 W Unit 139
- 1337 W 550 N Unit 195
- 423 N 1250 W Unit 118
- 16 N 1300 W
- 135 S 1525 W
- 1648 W 150 S
- 303 N Canterbury Way
- 1805 W 675 N
- 1828 W 75 S
- 417 N 1200 W Unit 84
- 12 N 2000 W Unit 1
- 1832 W 725 N
- 1827 W 775 N