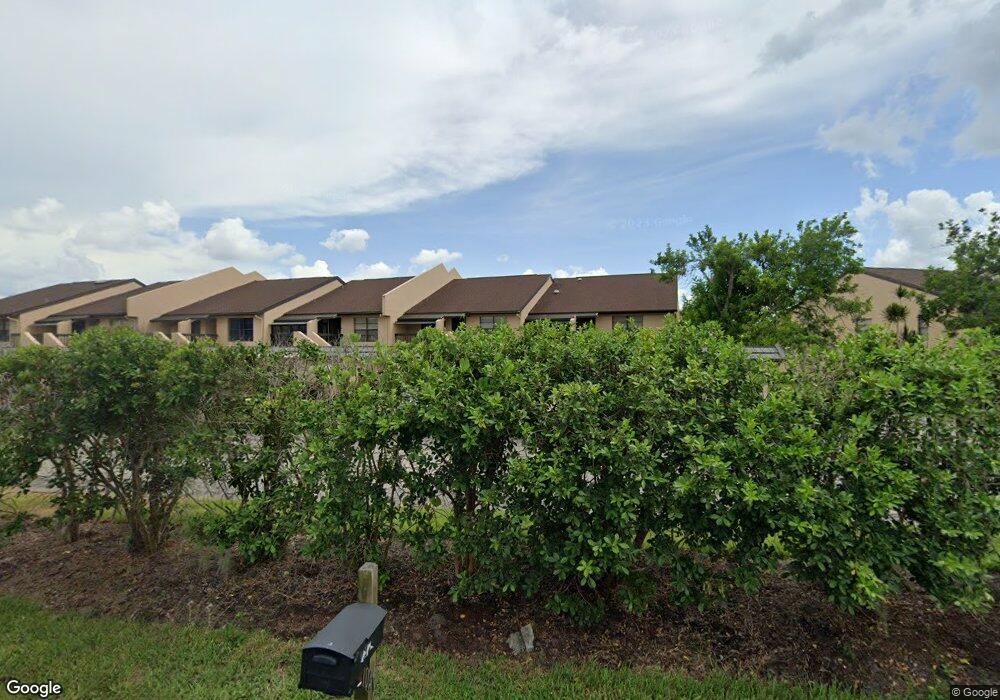
15460 Admiralty Cir Unit 2 North Fort Myers, FL 33917
Estimated Value: $174,328 - $237,000
2
Beds
2
Baths
1,060
Sq Ft
$184/Sq Ft
Est. Value
About This Home
This home is located at 15460 Admiralty Cir Unit 2, North Fort Myers, FL 33917 and is currently estimated at $195,332, approximately $184 per square foot. 15460 Admiralty Cir Unit 2 is a home located in Lee County with nearby schools including Bayshore Elementary School, Orange River Elementary School, and Tice Elementary School.
Ownership History
Date
Name
Owned For
Owner Type
Purchase Details
Closed on
Feb 14, 2019
Sold by
Siebenaler John H and Siebenaler Rae M
Bought by
Siebenaler John and Siebenaler Michael
Current Estimated Value
Purchase Details
Closed on
Mar 23, 2012
Sold by
Schultz Pamela M
Bought by
Siebenaler John H and Siebenaler Rae M
Purchase Details
Closed on
Jan 10, 2012
Sold by
Schultz Pamela Marie
Bought by
Schultz Pamela M
Purchase Details
Closed on
Jul 30, 2004
Sold by
Wimmer Donald L and Wimmer Hope S
Bought by
Neer Eric A and Neer Jennie J
Purchase Details
Closed on
Sep 20, 2001
Sold by
Muench George R and Muench Diane H
Bought by
Wimmer Donald L and Wimmer Hope S
Home Financials for this Owner
Home Financials are based on the most recent Mortgage that was taken out on this home.
Original Mortgage
$67,600
Interest Rate
6.97%
Mortgage Type
Purchase Money Mortgage
Create a Home Valuation Report for This Property
The Home Valuation Report is an in-depth analysis detailing your home's value as well as a comparison with similar homes in the area
Home Values in the Area
Average Home Value in this Area
Purchase History
| Date | Buyer | Sale Price | Title Company |
|---|---|---|---|
| Siebenaler John | -- | Attorney | |
| Siebenaler John | -- | Attorney | |
| Siebenaler John H | $95,000 | Sunbelt Title Agency | |
| Schultz Pamela M | -- | Attorney | |
| Schultz Pamela Marie | -- | Attorney | |
| Neer Eric A | $150,000 | Dba Commerce Title Company | |
| Wimmer Donald L | $84,500 | -- |
Source: Public Records
Mortgage History
| Date | Status | Borrower | Loan Amount |
|---|---|---|---|
| Previous Owner | Wimmer Donald L | $67,600 |
Source: Public Records
Tax History Compared to Growth
Tax History
| Year | Tax Paid | Tax Assessment Tax Assessment Total Assessment is a certain percentage of the fair market value that is determined by local assessors to be the total taxable value of land and additions on the property. | Land | Improvement |
|---|---|---|---|---|
| 2025 | $651 | $97,567 | -- | -- |
| 2024 | $17 | $94,817 | -- | -- |
| 2023 | $17 | $2,949 | $0 | $2,949 |
| 2022 | $842 | $89,374 | $0 | $0 |
| 2021 | $834 | $111,729 | $0 | $111,729 |
| 2020 | $832 | $85,573 | $0 | $0 |
| 2019 | $808 | $83,649 | $0 | $0 |
| 2018 | $798 | $82,089 | $0 | $0 |
| 2017 | $871 | $80,401 | $0 | $0 |
| 2016 | $779 | $98,903 | $0 | $98,903 |
| 2015 | $787 | $78,200 | $0 | $78,200 |
| 2014 | $792 | $78,400 | $0 | $78,400 |
| 2013 | -- | $89,815 | $0 | $89,815 |
Source: Public Records
Map
Nearby Homes
- 15464 Admiralty Cir Unit 6
- 15456 Admiralty Cir Unit 7
- 15466 Admiralty Cir Unit 4
- 7230 Reymoor Dr
- 15448 Admiralty Cir Unit 10
- 15448 Admiralty Cir Unit 8
- 15570 Paper Tree Ct
- 15444 Admiralty Cir Unit 4
- 1081 Butler Rd
- 15489 Admiralty Cir Unit 3
- 1818 Cherie Ln
- 6471 P G A Dr
- 1823 Stevenson Rd
- 1821 Stevenson Rd
- 6414 Ben Hogan Cir
- 15477 Admiralty Cir Unit 6
- 6419 Ben Hogan Cir
- 15472 Nelsons Walk Ct
- 7178 Coon Rd
- 6340 P G A Dr
- 15460 Admiralty Cir Unit 4
- 15460 Admiralty Cir Unit 11
- 15460 Admiralty Cir Unit 5
- 15460 Admiralty Cir Unit 12
- 15460 Admiralty Cir Unit 6
- 15460 Admiralty Cir Unit 3
- 15460 Admiralty Cir Unit 1
- 15460 Admiralty Cir Unit 10
- 15460 Admiralty Cir Unit 8
- 15460 Admiralty Cir Unit 9
- 15460 Admiralty Cir Unit 7
- 15464 Admiralty Cir Unit 11
- 15464 Admiralty Cir Unit 12
- 15464 Admiralty Cir Unit 10
- 15464 Admiralty Cir Unit 4
- 15464 Admiralty Cir Unit 5
- 15464 Admiralty Cir Unit 7
- 15464 Admiralty Cir Unit 3
- 15464 Admiralty Cir Unit 2
- 15464 Admiralty Cir Unit 8