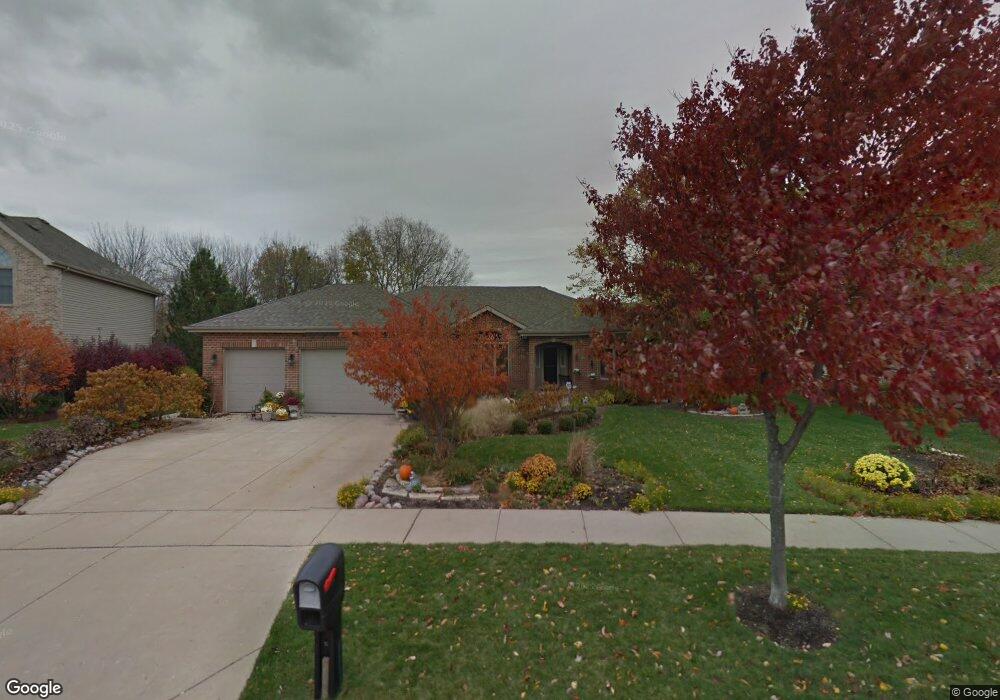
15464 Dan Patch Dr Plainfield, IL 60544
West Plainfield NeighborhoodEstimated Value: $490,507 - $596,000
3
Beds
3
Baths
2,144
Sq Ft
$250/Sq Ft
Est. Value
About This Home
This home is located at 15464 Dan Patch Dr, Plainfield, IL 60544 and is currently estimated at $535,627, approximately $249 per square foot. 15464 Dan Patch Dr is a home located in Will County with nearby schools including Richard Ira Jones Middle School, Plainfield North High School, and St Mary Immaculate Parish School.
Ownership History
Date
Name
Owned For
Owner Type
Purchase Details
Closed on
Dec 30, 2004
Sold by
Muchmore Anna Marie
Bought by
Vietoris Dennis and Vietoris Sharon
Current Estimated Value
Home Financials for this Owner
Home Financials are based on the most recent Mortgage that was taken out on this home.
Original Mortgage
$292,000
Outstanding Balance
$148,886
Interest Rate
5.9%
Mortgage Type
Purchase Money Mortgage
Estimated Equity
$386,741
Purchase Details
Closed on
Jun 18, 2003
Sold by
Sanfilippo Paula Marie
Bought by
Muchmore Anna Marie
Home Financials for this Owner
Home Financials are based on the most recent Mortgage that was taken out on this home.
Original Mortgage
$253,600
Interest Rate
3.87%
Mortgage Type
Purchase Money Mortgage
Purchase Details
Closed on
Dec 28, 2001
Sold by
Haycroft Builders Ltd
Bought by
Muchmore Anna Marie and San Filippo Paula L
Home Financials for this Owner
Home Financials are based on the most recent Mortgage that was taken out on this home.
Original Mortgage
$236,000
Interest Rate
7.07%
Create a Home Valuation Report for This Property
The Home Valuation Report is an in-depth analysis detailing your home's value as well as a comparison with similar homes in the area
Home Values in the Area
Average Home Value in this Area
Purchase History
| Date | Buyer | Sale Price | Title Company |
|---|---|---|---|
| Vietoris Dennis | $365,000 | Ticor Title Insurance Compan | |
| Muchmore Anna Marie | -- | Stewart Title Company | |
| Muchmore Anna Marie | $295,000 | Ticor Title |
Source: Public Records
Mortgage History
| Date | Status | Borrower | Loan Amount |
|---|---|---|---|
| Open | Vietoris Dennis | $292,000 | |
| Previous Owner | Muchmore Anna Marie | $253,600 | |
| Previous Owner | Muchmore Anna Marie | $236,000 |
Source: Public Records
Tax History
| Year | Tax Paid | Tax Assessment Tax Assessment Total Assessment is a certain percentage of the fair market value that is determined by local assessors to be the total taxable value of land and additions on the property. | Land | Improvement |
|---|---|---|---|---|
| 2024 | $10,490 | $158,283 | $38,027 | $120,256 |
| 2023 | $10,490 | $142,958 | $34,345 | $108,613 |
| 2022 | $9,935 | $128,395 | $30,846 | $97,549 |
| 2021 | $9,385 | $119,995 | $28,828 | $91,167 |
| 2020 | $9,252 | $116,590 | $28,010 | $88,580 |
| 2019 | $9,466 | $117,444 | $26,689 | $90,755 |
| 2018 | $9,207 | $112,216 | $25,076 | $87,140 |
| 2017 | $8,924 | $106,639 | $23,830 | $82,809 |
| 2016 | $8,706 | $101,707 | $22,728 | $78,979 |
| 2015 | $8,136 | $95,276 | $21,291 | $73,985 |
| 2014 | $8,136 | $91,912 | $20,539 | $71,373 |
| 2013 | $8,136 | $91,912 | $20,539 | $71,373 |
Source: Public Records
Map
Nearby Homes
- 24701 Kingston St
- 24914 W Illini Dr
- 24642 Lincolnway St
- 15738 Creekview Dr
- 24508 W Easy St
- 25035 W Soldier Dr
- 24825 Barolo Dr
- 14932 S Mccarthy Cir
- 14951 S Dyer Ln
- 14912 S Henebry Ln
- 14920 S Henebry Ln
- 14926 S Henebry Ln
- 14933 S Dyer Ln
- 14956 S Mccarthy Cir
- 14844 S Henebry Ln
- 14908 S Henebry Ln
- 14948 S Mccarthy Cir
- 14940 S Mccarthy Cir
- 15058 S Darr Dr
- 14962 S Henebry Ln
- 15454 Dan Patch Dr
- 15504 Dan Patch Dr
- 15539 S Pawnee St
- 15533 S Pawnee St
- 24801 W Prairie Dr
- 15527 S Pawnee St
- 15446 Dan Patch Dr
- 24734 Fairbanks Ct Unit 5
- 15457 Dan Patch Dr
- 15501 Dan Patch Dr Unit 5
- 24519 W Prairie Dr
- 24731 W Prairie Dr
- 15521 S Pawnee St
- 15447 Dan Patch Dr
- 24736 Fairbanks Ct
- 15436 Dan Patch Dr
- 24805 W Prairie Dr
- 24810 W Prairie Dr
- 15515 Dan Patch Dr
- 24612 W Prairie Dr
Your Personal Tour Guide
Ask me questions while you tour the home.