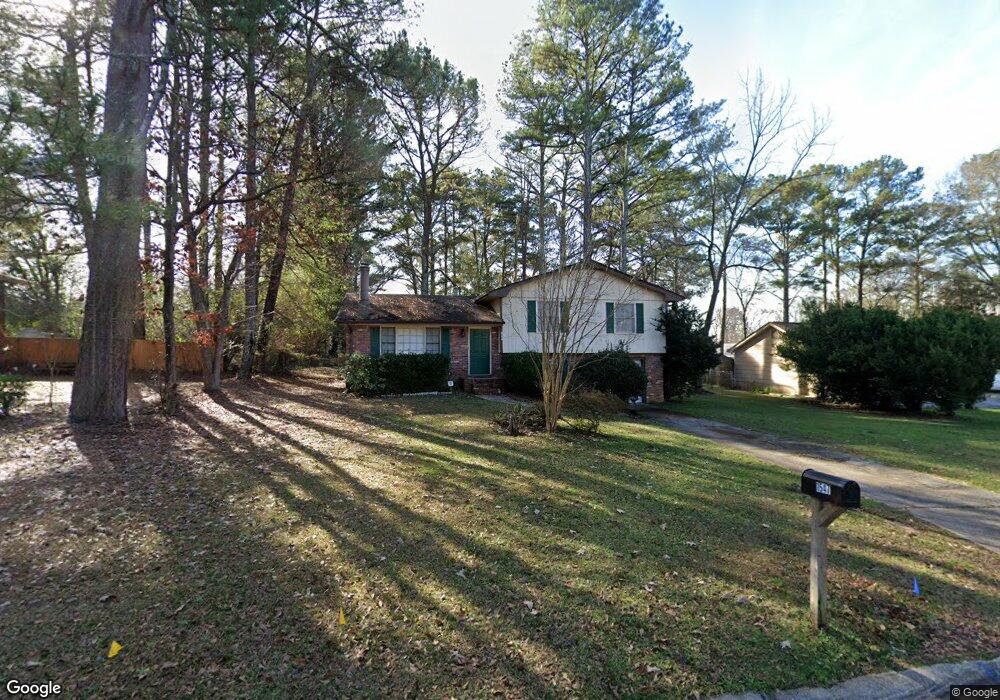
1547 Bogota Way Jonesboro, GA 30236
Estimated Value: $194,094 - $225,000
3
Beds
2
Baths
1,201
Sq Ft
$179/Sq Ft
Est. Value
About This Home
This home is located at 1547 Bogota Way, Jonesboro, GA 30236 and is currently estimated at $215,024, approximately $179 per square foot. 1547 Bogota Way is a home located in Clayton County with nearby schools including James Jackson Elementary School, Jonesboro Middle School, and Jonesboro High School.
Ownership History
Date
Name
Owned For
Owner Type
Purchase Details
Closed on
Jun 4, 2013
Sold by
Hazell Charmaine B
Bought by
Hazell Franklyn L
Current Estimated Value
Purchase Details
Closed on
Jun 8, 2001
Sold by
Hazell Franklyn L
Bought by
Hazell Franklyn L and Hazell Charmaine B
Home Financials for this Owner
Home Financials are based on the most recent Mortgage that was taken out on this home.
Original Mortgage
$92,894
Interest Rate
6.72%
Mortgage Type
FHA
Purchase Details
Closed on
May 31, 2000
Sold by
Hunter Ray
Bought by
Hazell Franklyn L
Home Financials for this Owner
Home Financials are based on the most recent Mortgage that was taken out on this home.
Original Mortgage
$94,124
Interest Rate
8.11%
Mortgage Type
FHA
Purchase Details
Closed on
Sep 5, 1995
Sold by
Sommerville Seth L
Bought by
Household Int L
Create a Home Valuation Report for This Property
The Home Valuation Report is an in-depth analysis detailing your home's value as well as a comparison with similar homes in the area
Home Values in the Area
Average Home Value in this Area
Purchase History
| Date | Buyer | Sale Price | Title Company |
|---|---|---|---|
| Hazell Franklyn L | -- | -- | |
| Hazell Franklyn L | -- | -- | |
| Hazell Franklyn L | $94,900 | -- | |
| Household Int L | $21,900 | -- |
Source: Public Records
Mortgage History
| Date | Status | Borrower | Loan Amount |
|---|---|---|---|
| Previous Owner | Hazell Franklyn L | $92,894 | |
| Previous Owner | Hazell Franklyn L | $94,124 |
Source: Public Records
Tax History Compared to Growth
Tax History
| Year | Tax Paid | Tax Assessment Tax Assessment Total Assessment is a certain percentage of the fair market value that is determined by local assessors to be the total taxable value of land and additions on the property. | Land | Improvement |
|---|---|---|---|---|
| 2024 | $1,692 | $53,360 | $8,000 | $45,360 |
| 2023 | $1,953 | $54,080 | $8,000 | $46,080 |
| 2022 | $1,543 | $49,320 | $8,000 | $41,320 |
| 2021 | $1,074 | $37,200 | $8,000 | $29,200 |
| 2020 | $1,033 | $35,839 | $8,000 | $27,839 |
| 2019 | $615 | $29,596 | $7,200 | $22,396 |
| 2018 | $634 | $25,620 | $7,200 | $18,420 |
| 2017 | $748 | $28,378 | $7,200 | $21,178 |
| 2016 | $580 | $24,255 | $7,200 | $17,055 |
| 2015 | $580 | $0 | $0 | $0 |
| 2014 | $552 | $23,867 | $7,200 | $16,667 |
Source: Public Records
Map
Nearby Homes
- 1608 Bogota Way
- 1699 Brenda Dr Unit 2
- 8033 Aloha Dr
- 7620 Mount Zion Blvd
- 1753 Brenda Dr
- 139 Cecelia Cir
- 7672 Echo Ln
- 1732 Winding Woods Ln
- 1837 Coventry Way
- 7621 Raleigh Ln
- 1904 Cades Cove
- 1198 Spur 138
- 7581 Livingston Dr
- 7431 Battlecreek Ln
- 7391 Garnet Dr
- 7972 Woods Ln Unit IX
- 248 Commons Dr
- 1170 Fifth Ave
- 1140 Spur 138
- 1130 Georgia 138
- 1559 Bogota Way
- 1533 Bogota Way
- 1548 Kidd Rd
- 1538 Kidd Rd
- 1569 Bogota Way
- 1546 Bogota Way
- 1560 Kidd Rd
- 1556 Bogota Way
- 1528 Kidd Rd
- 1550 Kidd Rd
- 1538 Bogota Way
- 1566 Bogota Way
- 1570 Kidd Rd
- 1581 Bogota Way
- 1581 Bogota Way Unit 5
- 1540 Bogota Way
- 1578 Bogota Way
- 1534 Bogota Way
- 1530 Bogota Way
- 1580 Kidd Rd