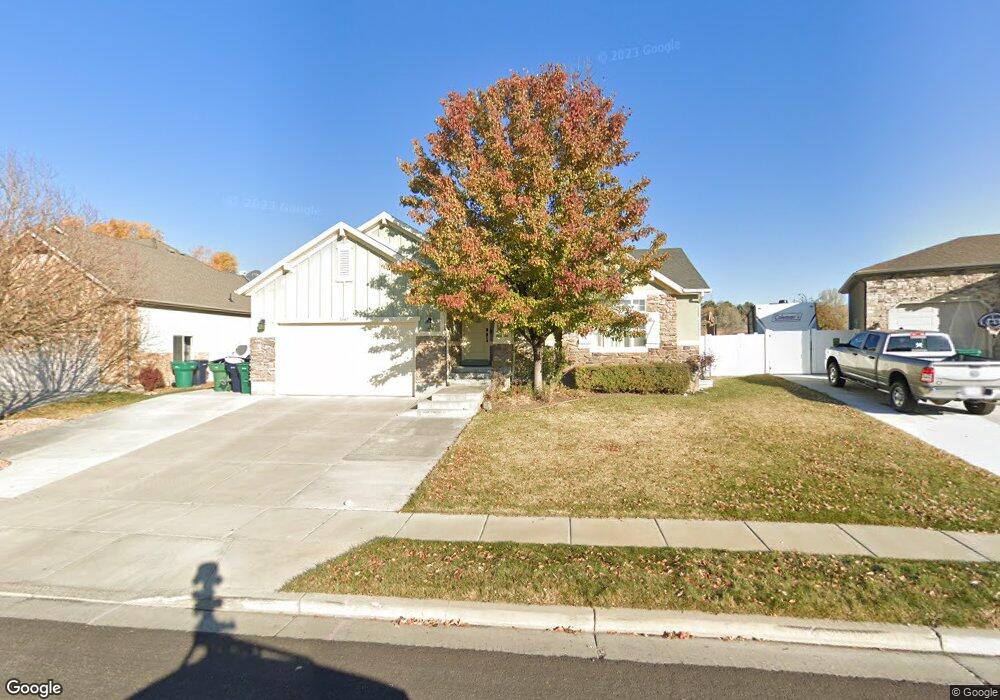
1547 E 925 S Clearfield, UT 84015
Estimated Value: $538,000 - $581,000
6
Beds
2
Baths
2,891
Sq Ft
$193/Sq Ft
Est. Value
About This Home
This home is located at 1547 E 925 S, Clearfield, UT 84015 and is currently estimated at $558,208, approximately $193 per square foot. 1547 E 925 S is a home located in Davis County with nearby schools including South Clearfield Elementary School, North Davis Junior High School, and Northridge High School.
Ownership History
Date
Name
Owned For
Owner Type
Purchase Details
Closed on
Mar 23, 2017
Sold by
Goodrich Rayn and Goodrich Tori
Bought by
Haueter Gordon L and Haueter Britany
Current Estimated Value
Home Financials for this Owner
Home Financials are based on the most recent Mortgage that was taken out on this home.
Original Mortgage
$295,704
Outstanding Balance
$245,214
Interest Rate
4.17%
Mortgage Type
New Conventional
Estimated Equity
$312,994
Purchase Details
Closed on
Nov 10, 2009
Sold by
Workman Wade and Workman Julia
Bought by
Goodrich Ryan and Goodrich Tori
Home Financials for this Owner
Home Financials are based on the most recent Mortgage that was taken out on this home.
Original Mortgage
$228,779
Interest Rate
4.83%
Mortgage Type
FHA
Purchase Details
Closed on
Nov 13, 2007
Sold by
Briarwood Hollow Llc
Bought by
Workman Wade and Workman Julia
Purchase Details
Closed on
Nov 27, 2006
Sold by
Murri Construction Inc
Bought by
Briarwood Hollow Llc
Create a Home Valuation Report for This Property
The Home Valuation Report is an in-depth analysis detailing your home's value as well as a comparison with similar homes in the area
Home Values in the Area
Average Home Value in this Area
Purchase History
| Date | Buyer | Sale Price | Title Company |
|---|---|---|---|
| Haueter Gordon L | -- | Inwest Title | |
| Goodrich Ryan | -- | Bonneville Superior Title | |
| Workman Wade | -- | Bonneville Superior Title Co | |
| Briarwood Hollow Llc | -- | Bonneville Superior Title Co |
Source: Public Records
Mortgage History
| Date | Status | Borrower | Loan Amount |
|---|---|---|---|
| Open | Haueter Gordon L | $295,704 | |
| Previous Owner | Goodrich Ryan | $228,779 |
Source: Public Records
Tax History
| Year | Tax Paid | Tax Assessment Tax Assessment Total Assessment is a certain percentage of the fair market value that is determined by local assessors to be the total taxable value of land and additions on the property. | Land | Improvement |
|---|---|---|---|---|
| 2025 | $3,284 | $294,250 | $73,665 | $220,585 |
| 2024 | $3,187 | $287,650 | $70,417 | $217,233 |
| 2023 | $2,933 | $486,000 | $112,552 | $373,448 |
| 2022 | $3,265 | $292,601 | $64,433 | $228,168 |
| 2021 | $2,807 | $380,000 | $69,058 | $310,942 |
| 2020 | $2,432 | $327,000 | $58,200 | $268,800 |
| 2019 | $2,343 | $311,000 | $60,541 | $250,459 |
| 2018 | $2,188 | $283,000 | $51,049 | $231,951 |
| 2016 | $1,889 | $127,710 | $21,509 | $106,201 |
| 2015 | $1,855 | $119,570 | $21,509 | $98,061 |
| 2014 | $2,222 | $145,185 | $21,509 | $123,676 |
| 2013 | -- | $105,192 | $35,156 | $70,036 |
Source: Public Records
Map
Nearby Homes
- 911 S 1500 E
- 1612 E 925 S
- 870 S 1625 E Unit A
- 1560 E 800 S Unit C
- 1543 E 750 S Unit C5
- 1520 E 1100 S
- 865 S 1650 E Unit A
- 1644 E 700 S
- 1127 E 1050 S
- 2931 N 1175 W
- 2896 N 1175 W
- 876 S 1000 E
- 1021 E 1225 S Unit A
- 1012 W 2525 N
- 897 E 1000 S
- 2320 N 1085 W
- 2298 N 1085 W
- 842 E 1000 S
- 1648 W 1920 N
- 732 E 1000 S
Your Personal Tour Guide
Ask me questions while you tour the home.