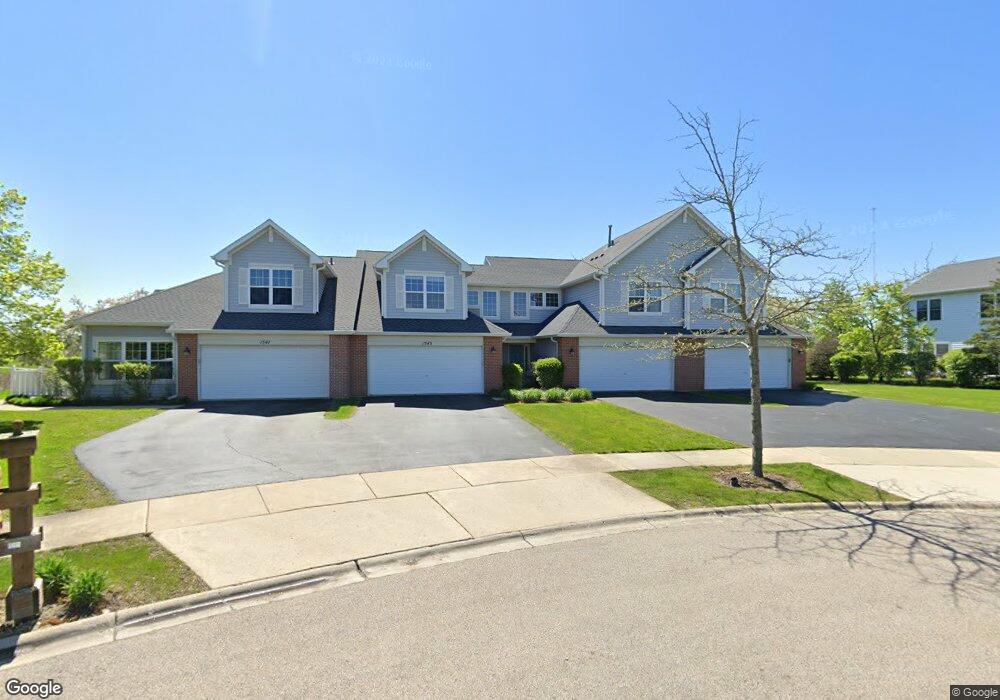
1547 S Candlestick Way Unit 3213 Waukegan, IL 60085
Southwest Waukegan NeighborhoodEstimated Value: $267,311 - $322,000
3
Beds
3
Baths
1,584
Sq Ft
$183/Sq Ft
Est. Value
About This Home
This home is located at 1547 S Candlestick Way Unit 3213, Waukegan, IL 60085 and is currently estimated at $289,578, approximately $182 per square foot. 1547 S Candlestick Way Unit 3213 is a home located in Lake County with nearby schools including Woodland Primary School, Woodland Elementary School, and Woodland Intermediate School.
Ownership History
Date
Name
Owned For
Owner Type
Purchase Details
Closed on
Jun 27, 2022
Sold by
Hendricks David R
Bought by
Singh Baljit and Kaur Harveer
Current Estimated Value
Home Financials for this Owner
Home Financials are based on the most recent Mortgage that was taken out on this home.
Original Mortgage
$165,000
Outstanding Balance
$157,999
Interest Rate
5.88%
Mortgage Type
New Conventional
Estimated Equity
$131,579
Purchase Details
Closed on
Sep 30, 2002
Sold by
Drh Cambridge Homes Inc
Bought by
Hendricks David R and Goldenstern Patricia A
Home Financials for this Owner
Home Financials are based on the most recent Mortgage that was taken out on this home.
Original Mortgage
$196,000
Interest Rate
6.24%
Mortgage Type
FHA
Create a Home Valuation Report for This Property
The Home Valuation Report is an in-depth analysis detailing your home's value as well as a comparison with similar homes in the area
Home Values in the Area
Average Home Value in this Area
Purchase History
| Date | Buyer | Sale Price | Title Company |
|---|---|---|---|
| Singh Baljit | $220,000 | Citywide Title | |
| Hendricks David R | $202,500 | -- |
Source: Public Records
Mortgage History
| Date | Status | Borrower | Loan Amount |
|---|---|---|---|
| Open | Singh Baljit | $165,000 | |
| Previous Owner | Hendricks David R | $196,000 |
Source: Public Records
Tax History Compared to Growth
Tax History
| Year | Tax Paid | Tax Assessment Tax Assessment Total Assessment is a certain percentage of the fair market value that is determined by local assessors to be the total taxable value of land and additions on the property. | Land | Improvement |
|---|---|---|---|---|
| 2024 | $8,526 | $74,550 | $8,975 | $65,575 |
| 2023 | $7,634 | $69,214 | $8,333 | $60,881 |
| 2022 | $7,634 | $61,771 | $7,034 | $54,737 |
| 2021 | $6,847 | $57,012 | $6,492 | $50,520 |
| 2020 | $6,745 | $55,610 | $6,332 | $49,278 |
| 2019 | $6,671 | $53,995 | $6,148 | $47,847 |
| 2018 | $5,966 | $48,099 | $6,047 | $42,052 |
| 2017 | $5,929 | $46,721 | $5,874 | $40,847 |
| 2016 | $5,876 | $44,640 | $5,612 | $39,028 |
| 2015 | $5,820 | $42,336 | $5,322 | $37,014 |
| 2014 | $6,635 | $48,902 | $5,280 | $43,622 |
| 2012 | $6,155 | $49,276 | $5,320 | $43,956 |
Source: Public Records
Map
Nearby Homes
- 1389 S Candlestick Way
- 4390 W Parkway Ave
- 14314 Towne Trail
- 4520 W Lawn Ave
- 601 Lakehurst Rd
- 4506 W Forest Ave
- 4437-4495 W Kennedy Dr
- 14875 Creekside Path
- 662 Waterbury Ave
- 0 Casimer Pulaski Dr Unit MRD12490157
- 33564 Greenleaf St
- 3810 1st St
- 450 Tanglewood Dr
- 3910 Ingleside Ave
- 0 Northwoods Ave Unit MRD11938775
- 00 Northwood Ave
- 4481 Country Trail Unit 1
- 4837 Middle Rd
- 3285 Meadow Dr
- 3513 Barb Ave Unit 178
- 1547 S Candlestick Way Unit 1547
- 1549 S Candlestick Way Unit 3214
- 1543 S Candlestick Way
- 1541 S Candlestick Way Unit 3211
- 1541 S Candlestick Way Unit 3211
- 1541 S Candlestick Way Unit 1541
- 1569 S Candlestick Way Unit 3233
- 1571 S Candlestick Way Unit 3234
- 1567 S Candlestick Way Unit 3232
- 1559 S Candlestick Way Unit 3224
- 1573 S Candlestick Way Unit 3235
- 1565 S Candlestick Way Unit 3231
- 1575 S Candlestick Way Unit 3236
- 1557 S Candlestick Way Unit 3223
- 1553 S Candlestick Way Unit 3222
- 1535 S Candlestick Way Unit 3206
- 1535 S Candlestick Way Unit 3206
- 1535 S Candlestick Way
- 1533 S Candlestick Way Unit 3205
- 1533 S Candlestick Way Unit 3205