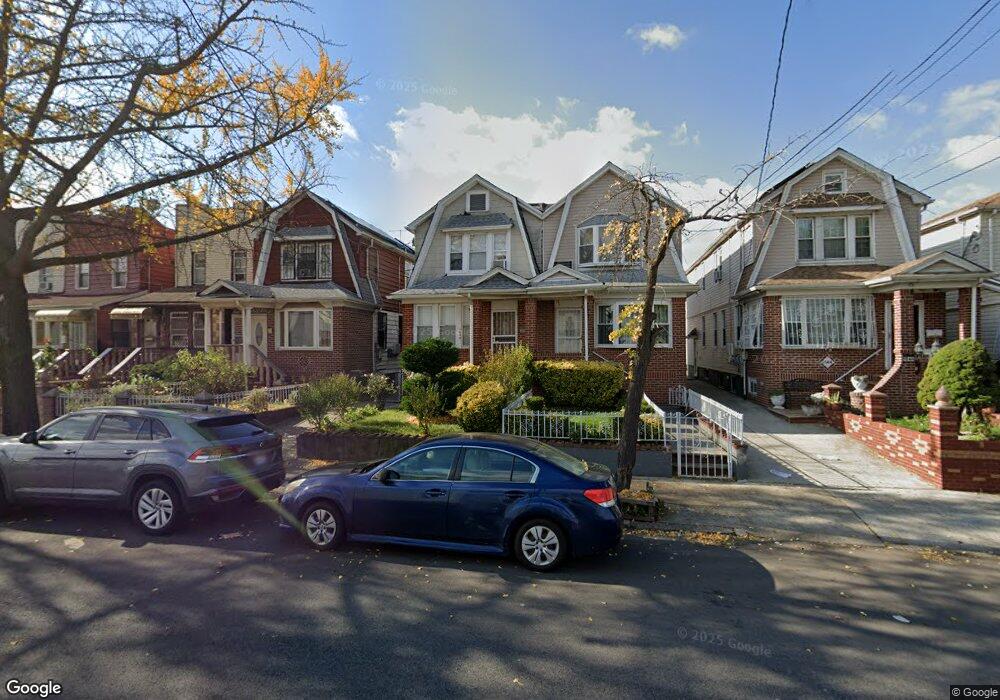
1548 Albany Ave Brooklyn, NY 11210
East Flatbush NeighborhoodEstimated Value: $724,639 - $834,000
--
Bed
--
Bath
1,504
Sq Ft
$513/Sq Ft
Est. Value
About This Home
This home is located at 1548 Albany Ave, Brooklyn, NY 11210 and is currently estimated at $772,160, approximately $513 per square foot. 1548 Albany Ave is a home located in Kings County with nearby schools including P.S. 198 Brooklyn, Andries Hudde School, and Christian Heritage Academy.
Ownership History
Date
Name
Owned For
Owner Type
Purchase Details
Closed on
Dec 20, 2010
Sold by
Buckley Derrick and Buckley Edgar
Bought by
Buckley Derrick and Buckley Elma
Current Estimated Value
Home Financials for this Owner
Home Financials are based on the most recent Mortgage that was taken out on this home.
Original Mortgage
$600,000
Outstanding Balance
$399,687
Interest Rate
4.46%
Mortgage Type
Purchase Money Mortgage
Estimated Equity
$372,473
Purchase Details
Closed on
Jan 14, 2005
Sold by
Buckley Derrick and Buckley Edgar
Bought by
Buckley Derrick and Buckley Edgar
Purchase Details
Closed on
Apr 10, 1995
Sold by
Buckley Derrick
Bought by
Buckley Derrick and Buckley Edgar
Purchase Details
Closed on
Dec 21, 1994
Sold by
Schiavo Frank
Bought by
Buckley Derrick and Buckley Edgar
Home Financials for this Owner
Home Financials are based on the most recent Mortgage that was taken out on this home.
Original Mortgage
$140,798
Interest Rate
9.23%
Mortgage Type
FHA
Create a Home Valuation Report for This Property
The Home Valuation Report is an in-depth analysis detailing your home's value as well as a comparison with similar homes in the area
Home Values in the Area
Average Home Value in this Area
Purchase History
| Date | Buyer | Sale Price | Title Company |
|---|---|---|---|
| Buckley Derrick | -- | -- | |
| Buckley Derrick | -- | -- | |
| Buckley Derrick | -- | -- | |
| Buckley Derrick | -- | -- | |
| Buckley Derrick | -- | Commonwealth Land Title Ins | |
| Buckley Derrick | -- | Commonwealth Land Title Ins | |
| Buckley Derrick | $142,000 | -- | |
| Buckley Derrick | $142,000 | -- |
Source: Public Records
Mortgage History
| Date | Status | Borrower | Loan Amount |
|---|---|---|---|
| Open | Buckley Derrick | $600,000 | |
| Closed | Buckley Derrick | $600,000 | |
| Previous Owner | Buckley Derrick | $140,798 | |
| Closed | Buckley Derrick | $0 |
Source: Public Records
Tax History Compared to Growth
Tax History
| Year | Tax Paid | Tax Assessment Tax Assessment Total Assessment is a certain percentage of the fair market value that is determined by local assessors to be the total taxable value of land and additions on the property. | Land | Improvement |
|---|---|---|---|---|
| 2025 | $6,157 | $32,700 | $12,720 | $19,980 |
| 2024 | $6,157 | $36,960 | $12,720 | $24,240 |
| 2023 | $5,904 | $39,360 | $12,720 | $26,640 |
| 2022 | $5,475 | $33,120 | $12,720 | $20,400 |
| 2021 | $5,446 | $31,500 | $12,720 | $18,780 |
| 2020 | $2,707 | $34,620 | $12,720 | $21,900 |
| 2019 | $5,343 | $34,620 | $12,720 | $21,900 |
| 2018 | $4,938 | $24,226 | $8,632 | $15,594 |
| 2017 | $4,659 | $22,856 | $9,970 | $12,886 |
| 2016 | $4,311 | $21,565 | $11,316 | $10,249 |
| 2015 | $2,381 | $21,565 | $14,038 | $7,527 |
| 2014 | $2,381 | $21,288 | $12,633 | $8,655 |
Source: Public Records
Map
Nearby Homes
- 881 E 39th St
- 786 E 40th St
- 4002 Glenwood Rd
- 3816 Glenwood Rd
- 954 E 39th St
- 712 E 40th St
- 664 E 42nd St
- 956 E 37th St
- 1390 Troy Ave
- 775 E 37th St
- 3521 Glenwood Rd
- 677 E 38th St
- 1604 Brooklyn Ave
- 953 E 42nd St
- 1646 Troy Ave
- 966 E 42nd St
- 1681 Brooklyn Ave
- 1352 Troy Ave
- 627 E 42nd St
- 720 Brooklyn Ave Unit 5K
- 1552 Albany Ave
- 1546 Albany Ave
- 1554 Albany Ave
- 1544 Albany Ave
- 1556 Albany Ave
- 1542 Albany Ave
- 1558 Albany Ave
- 1540 Albany Ave
- 1560 Albany Ave
- 1536 Albany Ave
- 817 E 40th St
- 819 E 40th St
- 813 E 40th St
- 1562 Albany Ave
- 1534 Albany Ave
- 825 E 40th St
- 809 E 40th St
- 1564 Albany Ave
- 829 E 40th St
- 1532 Albany Ave