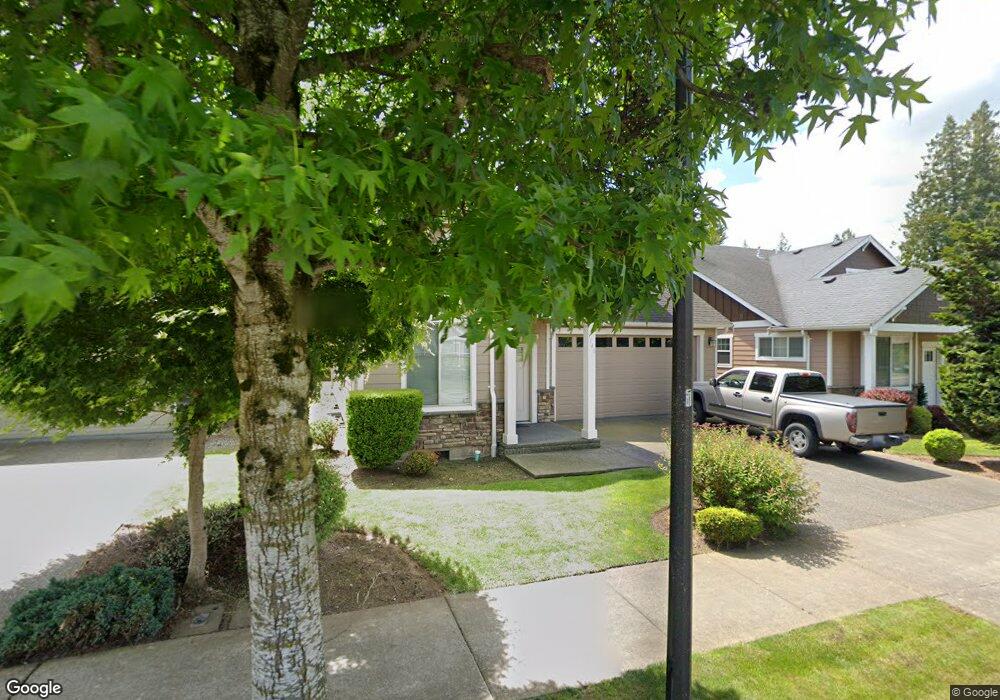
1548 Bryce Park Loop Unit 22 Lynden, WA 98264
Estimated Value: $559,000 - $642,000
3
Beds
3
Baths
2,131
Sq Ft
$286/Sq Ft
Est. Value
About This Home
This home is located at 1548 Bryce Park Loop Unit 22, Lynden, WA 98264 and is currently estimated at $608,520, approximately $285 per square foot. 1548 Bryce Park Loop Unit 22 is a home located in Whatcom County with nearby schools including Lynden High School, Cornerstone Christian School, and Covenant Christian School.
Ownership History
Date
Name
Owned For
Owner Type
Purchase Details
Closed on
Jan 4, 2022
Sold by
Peng and Meilan
Bought by
Lord Brandon
Current Estimated Value
Home Financials for this Owner
Home Financials are based on the most recent Mortgage that was taken out on this home.
Original Mortgage
$414,375
Outstanding Balance
$381,597
Interest Rate
3.05%
Mortgage Type
New Conventional
Estimated Equity
$226,923
Purchase Details
Closed on
Oct 5, 2015
Sold by
New Worc Iv Development & Management Llc
Bought by
Peng Shucheng
Purchase Details
Closed on
Dec 22, 2010
Sold by
Bp Retirement Development Llc
Bought by
New Worc Iv Development & Management Llc
Purchase Details
Closed on
Apr 2, 2010
Sold by
Bryce Park Llc
Bought by
Bp Retirement Development Llc
Home Financials for this Owner
Home Financials are based on the most recent Mortgage that was taken out on this home.
Original Mortgage
$1,305,675
Interest Rate
4.88%
Mortgage Type
Commercial
Create a Home Valuation Report for This Property
The Home Valuation Report is an in-depth analysis detailing your home's value as well as a comparison with similar homes in the area
Home Values in the Area
Average Home Value in this Area
Purchase History
| Date | Buyer | Sale Price | Title Company |
|---|---|---|---|
| Lord Brandon | $487,500 | Whatcom Land Title | |
| Peng Shucheng | -- | Whatcom Land Title | |
| New Worc Iv Development & Management Llc | $628,280 | Whatcom Land Title | |
| Bp Retirement Development Llc | $1,300,280 | Whatcom Land Title |
Source: Public Records
Mortgage History
| Date | Status | Borrower | Loan Amount |
|---|---|---|---|
| Open | Lord Brandon | $414,375 | |
| Previous Owner | Bp Retirement Development Llc | $1,305,675 |
Source: Public Records
Tax History Compared to Growth
Tax History
| Year | Tax Paid | Tax Assessment Tax Assessment Total Assessment is a certain percentage of the fair market value that is determined by local assessors to be the total taxable value of land and additions on the property. | Land | Improvement |
|---|---|---|---|---|
| 2024 | $4,044 | $570,845 | $194,000 | $376,845 |
| 2023 | $4,044 | $562,351 | $200,000 | $362,351 |
| 2022 | $4,112 | $539,420 | $137,188 | $402,232 |
| 2021 | $4,033 | $445,796 | $113,377 | $332,419 |
| 2020 | $3,533 | $398,043 | $101,232 | $296,811 |
| 2019 | $3,144 | $365,025 | $92,948 | $272,077 |
| 2018 | $3,436 | $332,928 | $84,672 | $248,256 |
| 2017 | $2,972 | $298,831 | $76,000 | $222,831 |
| 2016 | $2,795 | $274,910 | $55,000 | $219,910 |
| 2015 | $2,478 | $257,123 | $52,900 | $204,223 |
| 2014 | -- | $248,417 | $51,100 | $197,317 |
| 2013 | -- | $247,317 | $50,000 | $197,317 |
Source: Public Records
Map
Nearby Homes
- 2201 Dejong Dr
- 2205 Dejong Dr
- 8885 Line Rd
- 1725 Aaron Dr
- 2202 Berryman Loop
- 1660 Eastwood Way
- 1402 Bradley Meadows Ln
- 1319 Bradley Ct
- 1136 N Cascade Ct
- 2021 Brome St
- 1112 N Cascade Ct
- 2029 Brome St
- 1792 Bradley Rd
- 8865 Northwood Rd
- 2027 Steelhead Way
- 1251 Garden Cir
- 2014 Monteview Ct
- 1178 E Grover St Unit 101
- 2080 Bowfin Way
- 2105 Lagerwey Cir
- 1548 Bryce Park Loop
- 1550 Bryce Park Loop Unit 23
- 1544 Bryce Park Loop
- 1518 Scenic Place
- 1534 Scenic Place
- 1557 Bryce Park Loop
- 1550 Scenic Place
- 1540 Bryce Park Loop
- 1523 Bryce Park Loop
- 1555 Bryce Park Lp
- 1555 Bryce Park Loop
- 1556 Bryce Park Loop Unit 25
- 1560 Bryce Park Loop
- 1577 Scenic Place
- 1559 Bryce Park Loop
- 1538 Bryce Park Loop