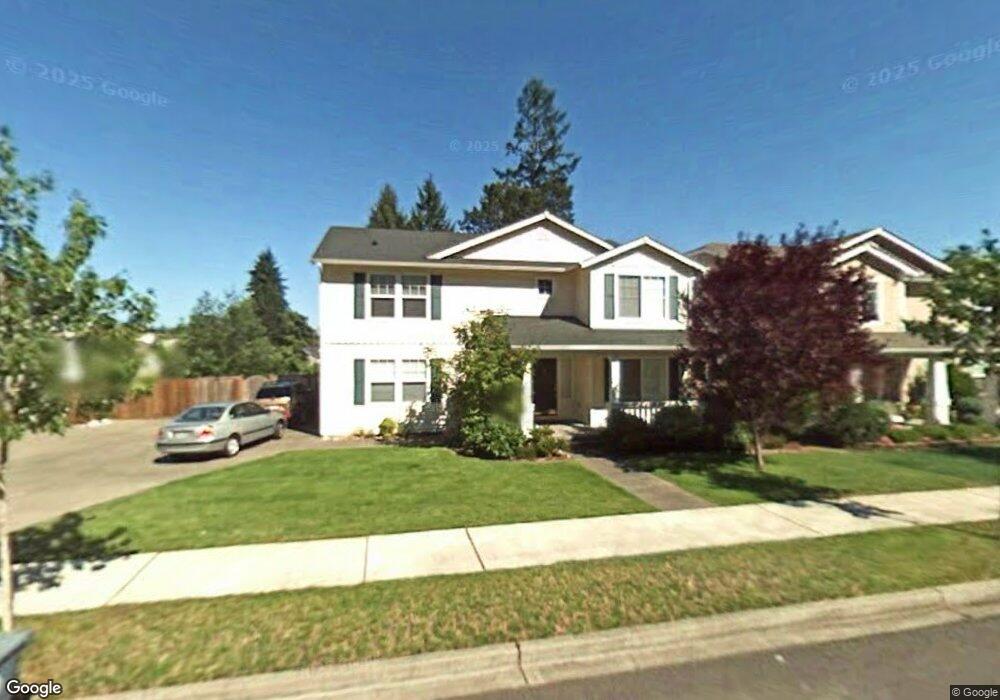
1548 Jensen Ave Dupont, WA 98327
Estimated Value: $596,000 - $648,000
3
Beds
3
Baths
2,513
Sq Ft
$251/Sq Ft
Est. Value
About This Home
This home is located at 1548 Jensen Ave, Dupont, WA 98327 and is currently estimated at $630,209, approximately $250 per square foot. 1548 Jensen Ave is a home located in Pierce County with nearby schools including Chloe Clark Elementary School, Saltars Point Elementary School, and Pioneer Middle School.
Ownership History
Date
Name
Owned For
Owner Type
Purchase Details
Closed on
Mar 9, 2020
Sold by
Scott Alfred and Scott Alfred
Bought by
Medina Jose R and Gonzalez Karla E
Current Estimated Value
Home Financials for this Owner
Home Financials are based on the most recent Mortgage that was taken out on this home.
Original Mortgage
$450,660
Outstanding Balance
$398,363
Interest Rate
3.4%
Mortgage Type
VA
Estimated Equity
$231,846
Purchase Details
Closed on
Feb 28, 2002
Sold by
The Quadrant Corp
Bought by
Scott Alfred and Scott Marcella
Home Financials for this Owner
Home Financials are based on the most recent Mortgage that was taken out on this home.
Original Mortgage
$205,639
Interest Rate
6.8%
Mortgage Type
VA
Purchase Details
Closed on
Oct 11, 2001
Sold by
Weyerhaeuser Real Estate Company
Bought by
Quadrant Corp
Create a Home Valuation Report for This Property
The Home Valuation Report is an in-depth analysis detailing your home's value as well as a comparison with similar homes in the area
Home Values in the Area
Average Home Value in this Area
Purchase History
| Date | Buyer | Sale Price | Title Company |
|---|---|---|---|
| Medina Jose R | $390,730 | Rainier Title | |
| Scott Alfred | $213,351 | Chicago Title | |
| Quadrant Corp | -- | Chicago Title |
Source: Public Records
Mortgage History
| Date | Status | Borrower | Loan Amount |
|---|---|---|---|
| Open | Medina Jose R | $450,660 | |
| Previous Owner | Scott Alfred | $205,639 |
Source: Public Records
Tax History Compared to Growth
Tax History
| Year | Tax Paid | Tax Assessment Tax Assessment Total Assessment is a certain percentage of the fair market value that is determined by local assessors to be the total taxable value of land and additions on the property. | Land | Improvement |
|---|---|---|---|---|
| 2025 | $4,461 | $599,900 | $254,200 | $345,700 |
| 2024 | $4,461 | $572,000 | $244,900 | $327,100 |
| 2023 | $4,461 | $554,500 | $244,800 | $309,700 |
| 2022 | $4,419 | $563,900 | $244,800 | $319,100 |
| 2021 | $4,192 | $416,500 | $155,500 | $261,000 |
| 2019 | $3,716 | $377,900 | $129,600 | $248,300 |
| 2018 | $4,043 | $363,500 | $129,600 | $233,900 |
| 2017 | $3,624 | $346,500 | $116,000 | $230,500 |
| 2016 | $3,457 | $310,400 | $97,900 | $212,500 |
| 2014 | $3,319 | $307,200 | $97,900 | $209,300 |
| 2013 | $3,319 | $283,700 | $99,200 | $184,500 |
Source: Public Records
Map
Nearby Homes
- 2420 Simmons St Unit B
- 3114 Walker Rd
- 3073 Hoffman Hill Blvd
- 2055 Garry Oaks Ave Unit B
- 1975 Garry Oaks Ave Unit C
- 1375 Foreman Rd
- 3178 Hoffman Hill Blvd
- 1335 Foreman Rd
- 3172 Sheaser Way
- 1305 Foreman Rd
- 1162 Swan Loop
- 3572 Hoffman Hill Blvd
- 1061 Hiton Cir
- 1856 Spencer Ct Unit 12F
- 1607 Kincaid St Unit E-8
- 1680 Kennedy Place Unit A4
- 2176 McDonald Ave
- 2237 Tolmie St
- 2176 Palisade Blvd Unit F-3
- 2147 Hammond Ave Unit B10
- 1566 Jensen Ave
- 1530 Jensen Ave
- 1572 Jensen Ave
- 2727 Meyer St
- 1547 Jensen Ave
- 1531 Jensen Ave
- 1565 Jensen Ave
- 2741 Meyer St
- 1584 Jensen Ave
- 1525 Jensen Ave
- 1502 Jensen Ave
- 1571 Jensen Ave
- 798 Jensen Ave
- 898 Jensen Ave
- 902 Jensen Ave
- 950 Jensen Ave
- 2703 Meyer St
- 1513 Jensen Ave
- 1583 Jensen Ave
- 2767 Meyer St