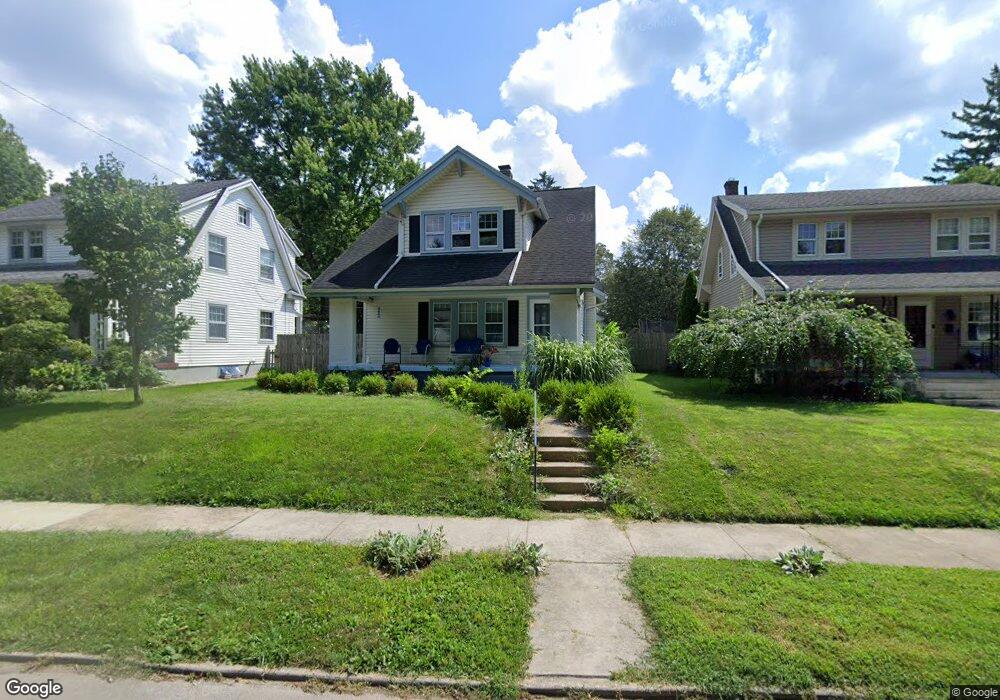
1548 Stockton Ave Dayton, OH 45409
Estimated Value: $210,000 - $256,000
3
Beds
1
Bath
1,265
Sq Ft
$185/Sq Ft
Est. Value
About This Home
This home is located at 1548 Stockton Ave, Dayton, OH 45409 and is currently estimated at $233,423, approximately $184 per square foot. 1548 Stockton Ave is a home located in Montgomery County with nearby schools including Southdale Elementary School, Van Buren Middle School, and Kettering Fairmont High School.
Ownership History
Date
Name
Owned For
Owner Type
Purchase Details
Closed on
May 16, 2016
Sold by
Crawford Ryan A and Crawford Adrienne
Bought by
Calderon Danielle R
Current Estimated Value
Home Financials for this Owner
Home Financials are based on the most recent Mortgage that was taken out on this home.
Original Mortgage
$111,600
Outstanding Balance
$88,638
Interest Rate
3.59%
Mortgage Type
Future Advance Clause Open End Mortgage
Estimated Equity
$144,785
Purchase Details
Closed on
Dec 23, 2011
Sold by
Whitehead Betty L
Bought by
Crawford Ryan A
Home Financials for this Owner
Home Financials are based on the most recent Mortgage that was taken out on this home.
Original Mortgage
$92,103
Interest Rate
4.25%
Mortgage Type
FHA
Purchase Details
Closed on
Jun 13, 2006
Sold by
Whitehead Betty Lou and Whitehead Harold E
Bought by
Whitehead Harold E and Whitehead Betty L
Create a Home Valuation Report for This Property
The Home Valuation Report is an in-depth analysis detailing your home's value as well as a comparison with similar homes in the area
Home Values in the Area
Average Home Value in this Area
Purchase History
| Date | Buyer | Sale Price | Title Company |
|---|---|---|---|
| Calderon Danielle R | $124,000 | Landmark Title Agency South | |
| Crawford Ryan A | $94,500 | National Title Company | |
| Whitehead Harold E | -- | None Available |
Source: Public Records
Mortgage History
| Date | Status | Borrower | Loan Amount |
|---|---|---|---|
| Open | Calderon Danielle R | $111,600 | |
| Previous Owner | Crawford Ryan A | $92,103 |
Source: Public Records
Tax History Compared to Growth
Tax History
| Year | Tax Paid | Tax Assessment Tax Assessment Total Assessment is a certain percentage of the fair market value that is determined by local assessors to be the total taxable value of land and additions on the property. | Land | Improvement |
|---|---|---|---|---|
| 2024 | $3,653 | $58,710 | $15,820 | $42,890 |
| 2023 | $3,653 | $58,710 | $15,820 | $42,890 |
| 2022 | $3,299 | $41,890 | $11,300 | $30,590 |
| 2021 | $3,052 | $41,890 | $11,300 | $30,590 |
| 2020 | $3,062 | $41,890 | $11,300 | $30,590 |
| 2019 | $2,789 | $33,710 | $10,760 | $22,950 |
| 2018 | $2,804 | $33,710 | $10,760 | $22,950 |
| 2017 | $2,584 | $33,710 | $10,760 | $22,950 |
| 2016 | $2,701 | $33,140 | $10,760 | $22,380 |
| 2015 | $2,581 | $33,140 | $10,760 | $22,380 |
| 2014 | $2,581 | $33,140 | $10,760 | $22,380 |
| 2012 | -- | $33,170 | $10,550 | $22,620 |
Source: Public Records
Map
Nearby Homes
- 1473 Constance Ave Unit 1481
- 1597 Old Lane Ave
- 1536 Old Lane Ave
- 2467 S Dixie Dr
- 1545 Cardington Rd
- 1420 Adirondack Trail
- 1615 Carrollton Ave
- 1554 Crescent Blvd
- 2230 S Patterson Blvd
- 1424 Elmdale Dr
- 1364 Elmdale Dr
- 1129 W Dorothy Ln
- 1211 Runnymede Rd
- 3060 Regent St
- 1160 Waving Willow Dr
- 3225 Southdale Dr Unit 1
- 1151 Brookview Ave
- 447 Kramer Rd
- 1314 Ridgeview Ave
- 1125 Laurelwood Rd
- 1540 Stockton Ave
- 1556 Stockton Ave
- 1532 Stockton Ave
- 1564 Stockton Ave
- 1572 Stockton Ave
- 1524 Stockton Ave
- 1549 Glenbeck Ave
- 1541 Glenbeck Ave
- 1516 Stockton Ave
- 1557 Glenbeck Ave
- 1580 Stockton Ave
- 1533 Glenbeck Ave
- 1549 Stockton Ave
- 1557 Stockton Ave
- 1541 Stockton Ave
- 1565 Stockton Ave
- 1565 Glenbeck Ave
- 1525 Glenbeck Ave
- 1533 Stockton Ave
- 1573 Stockton Ave