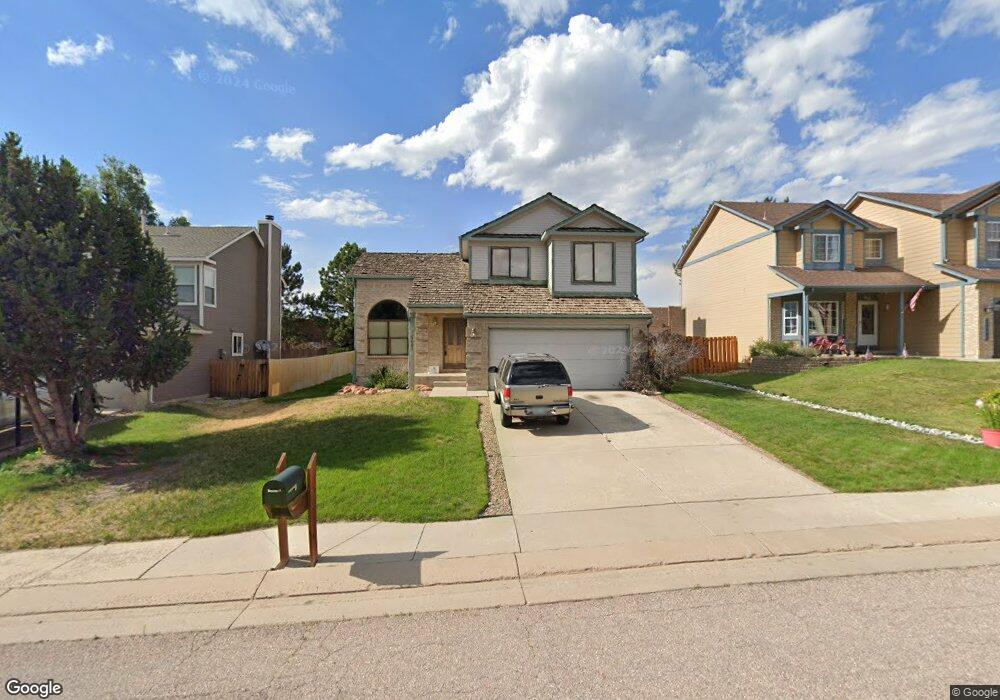
15480 Holbein Dr Colorado Springs, CO 80921
Gleneagle NeighborhoodEstimated Value: $502,000 - $605,000
3
Beds
3
Baths
1,650
Sq Ft
$326/Sq Ft
Est. Value
About This Home
This home is located at 15480 Holbein Dr, Colorado Springs, CO 80921 and is currently estimated at $538,661, approximately $326 per square foot. 15480 Holbein Dr is a home located in El Paso County with nearby schools including Antelope Trails Elementary School, Discovery Canyon Campus Middle School, and Discovery Canyon Campus High School.
Ownership History
Date
Name
Owned For
Owner Type
Purchase Details
Closed on
Sep 7, 2001
Sold by
Stubbs Garne L and Stubbs Karen
Bought by
Pencoff Charles Ivan and Pencoff Karen M
Current Estimated Value
Home Financials for this Owner
Home Financials are based on the most recent Mortgage that was taken out on this home.
Original Mortgage
$174,800
Outstanding Balance
$68,014
Interest Rate
6.96%
Estimated Equity
$470,648
Purchase Details
Closed on
Mar 15, 1999
Sold by
Tunney Brian S and Tunney Julie A
Bought by
Stubbs Garne L and Stubbs Karen
Home Financials for this Owner
Home Financials are based on the most recent Mortgage that was taken out on this home.
Original Mortgage
$75,000
Interest Rate
6.74%
Purchase Details
Closed on
Aug 10, 1994
Sold by
Elite Properties Of America Inc
Bought by
Tunney Brian S and Tunney Julie A
Home Financials for this Owner
Home Financials are based on the most recent Mortgage that was taken out on this home.
Original Mortgage
$126,176
Interest Rate
8.51%
Mortgage Type
FHA
Create a Home Valuation Report for This Property
The Home Valuation Report is an in-depth analysis detailing your home's value as well as a comparison with similar homes in the area
Home Values in the Area
Average Home Value in this Area
Purchase History
| Date | Buyer | Sale Price | Title Company |
|---|---|---|---|
| Pencoff Charles Ivan | $184,000 | Security Title | |
| Stubbs Garne L | $149,900 | Stewart Title | |
| Tunney Brian S | $130,099 | Land Title |
Source: Public Records
Mortgage History
| Date | Status | Borrower | Loan Amount |
|---|---|---|---|
| Open | Pencoff Charles Ivan | $174,800 | |
| Previous Owner | Stubbs Garne L | $75,000 | |
| Previous Owner | Tunney Brian S | $126,176 |
Source: Public Records
Tax History Compared to Growth
Tax History
| Year | Tax Paid | Tax Assessment Tax Assessment Total Assessment is a certain percentage of the fair market value that is determined by local assessors to be the total taxable value of land and additions on the property. | Land | Improvement |
|---|---|---|---|---|
| 2025 | $2,792 | $35,870 | -- | -- |
| 2024 | $2,832 | $33,100 | $4,410 | $28,690 |
| 2023 | $2,832 | $33,100 | $4,410 | $28,690 |
| 2022 | $2,422 | $23,050 | $4,160 | $18,890 |
| 2021 | $2,605 | $23,710 | $4,280 | $19,430 |
| 2020 | $2,351 | $20,450 | $3,720 | $16,730 |
| 2019 | $2,335 | $20,450 | $3,720 | $16,730 |
| 2018 | $1,829 | $15,840 | $3,240 | $12,600 |
| 2017 | $1,825 | $15,840 | $3,240 | $12,600 |
| 2016 | $1,542 | $15,360 | $3,140 | $12,220 |
| 2015 | $1,540 | $15,360 | $3,140 | $12,220 |
| 2014 | $1,440 | $14,360 | $3,140 | $11,220 |
Source: Public Records
Map
Nearby Homes
- 15450 Holbein Dr
- 15427 Jessie Dr
- 15216 Paddington Cir
- 160 Holbrook St
- 15605 Transcontinental Dr
- 107 Pistol Creek Dr
- 17 Pistol Creek Dr
- 240 Wuthering Heights Dr
- 15635 Split Creek Dr
- 670 E Baptist Rd
- 15628 Dawson Creek Dr
- 127 Misty Creek Dr
- 270 Rangely Dr
- 410 Palm Springs Way
- 132 Kettle Valley Way
- 953 Pinenut Ct
- 16017 Denver Pacific Dr
- 16149 Penn Central Way
- 14925 Pristine Dr
- 15711 Lacuna Dr
- 15470 Holbein Dr
- 15490 Holbein Dr
- 15510 Holbein Dr
- 15460 Holbein Dr
- 15485 Holbein Dr
- 15495 Holbein Dr
- 15520 Holbein Dr
- 15465 Holbein Dr
- 15515 Holbein Dr
- 15530 Holbein Dr
- 15525 Holbein Dr
- 15445 Holbein Dr
- 15440 Holbein Dr
- 15430 Paddington Cir
- 15420 Paddington Cir
- 15535 Holbein Dr
- 15440 Paddington Cir
- 15540 Holbein Dr
- 15425 Holbein Dr
- 15430 Holbein Dr