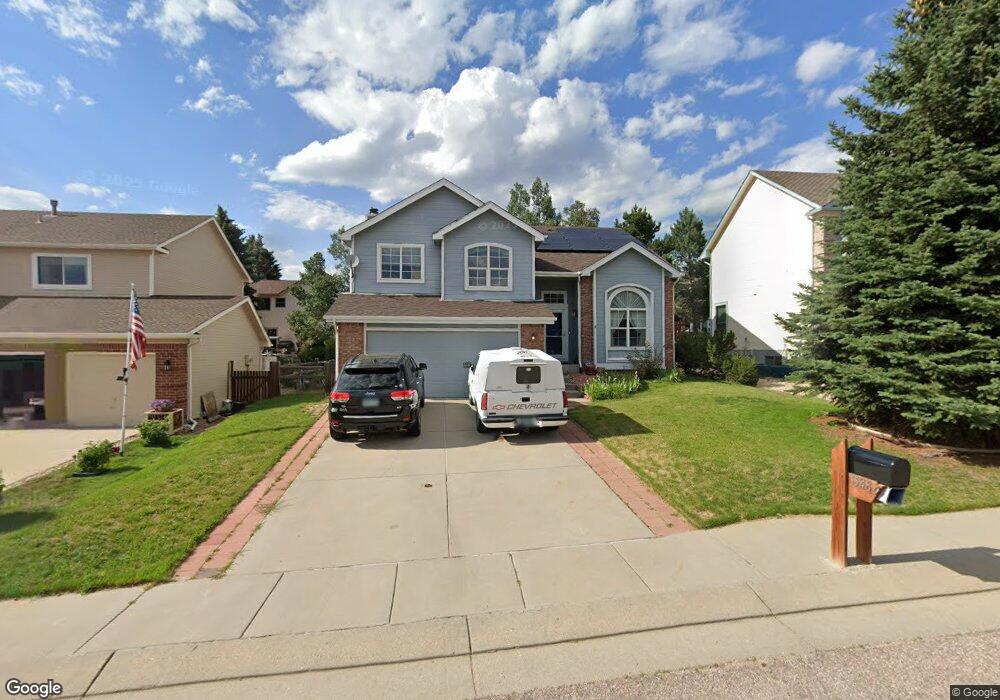
15480 Paddington Cir Colorado Springs, CO 80921
Gleneagle NeighborhoodEstimated Value: $523,022 - $596,000
3
Beds
3
Baths
1,918
Sq Ft
$292/Sq Ft
Est. Value
About This Home
This home is located at 15480 Paddington Cir, Colorado Springs, CO 80921 and is currently estimated at $561,006, approximately $292 per square foot. 15480 Paddington Cir is a home located in El Paso County with nearby schools including Antelope Trails Elementary School, Discovery Canyon Campus Middle School, and Discovery Canyon Campus High School.
Ownership History
Date
Name
Owned For
Owner Type
Purchase Details
Closed on
Sep 21, 2024
Sold by
Cole David W
Bought by
Cole Living Trust and Cole
Current Estimated Value
Home Financials for this Owner
Home Financials are based on the most recent Mortgage that was taken out on this home.
Original Mortgage
$332,213
Outstanding Balance
$328,493
Interest Rate
6.49%
Mortgage Type
FHA
Estimated Equity
$232,513
Purchase Details
Closed on
Nov 9, 1994
Sold by
Vantage Homes Corp
Bought by
Cole David Wayne and Cole Doris E
Home Financials for this Owner
Home Financials are based on the most recent Mortgage that was taken out on this home.
Original Mortgage
$117,600
Interest Rate
8.78%
Purchase Details
Closed on
Feb 23, 1994
Sold by
Bethesda Management Company
Bought by
Vantage Homes Corp
Purchase Details
Closed on
Sep 23, 1993
Bought by
Cole David W Trustee
Create a Home Valuation Report for This Property
The Home Valuation Report is an in-depth analysis detailing your home's value as well as a comparison with similar homes in the area
Home Values in the Area
Average Home Value in this Area
Purchase History
| Date | Buyer | Sale Price | Title Company |
|---|---|---|---|
| Cole Living Trust | -- | None Listed On Document | |
| Cole David W | -- | None Listed On Document | |
| Cole David Wayne | -- | -- | |
| Vantage Homes Corp | -- | -- | |
| Cole David W Trustee | -- | -- |
Source: Public Records
Mortgage History
| Date | Status | Borrower | Loan Amount |
|---|---|---|---|
| Open | Cole David W | $332,213 | |
| Previous Owner | Cole David Wayne | $117,600 |
Source: Public Records
Tax History Compared to Growth
Tax History
| Year | Tax Paid | Tax Assessment Tax Assessment Total Assessment is a certain percentage of the fair market value that is determined by local assessors to be the total taxable value of land and additions on the property. | Land | Improvement |
|---|---|---|---|---|
| 2025 | $2,890 | $37,360 | -- | -- |
| 2024 | $2,259 | $34,130 | $4,410 | $29,720 |
| 2023 | $2,259 | $34,130 | $4,410 | $29,720 |
| 2022 | $1,774 | $23,830 | $4,160 | $19,670 |
| 2021 | $1,908 | $24,510 | $4,280 | $20,230 |
| 2020 | $1,761 | $22,470 | $3,720 | $18,750 |
| 2019 | $1,749 | $22,470 | $3,720 | $18,750 |
| 2018 | $1,178 | $17,400 | $3,240 | $14,160 |
| 2017 | $1,175 | $17,400 | $3,240 | $14,160 |
| 2016 | $899 | $16,920 | $3,140 | $13,780 |
| 2015 | $898 | $16,920 | $3,140 | $13,780 |
| 2014 | $792 | $15,810 | $3,140 | $12,670 |
Source: Public Records
Map
Nearby Homes
- 15450 Holbein Dr
- 15427 Jessie Dr
- 15216 Paddington Cir
- 670 E Baptist Rd
- 240 Wuthering Heights Dr
- 15605 Transcontinental Dr
- 625 Rembrandt Ct
- 15350 Ridgefield Ln
- 61 Misty Creek Dr
- 107 Pistol Creek Dr
- 270 Rangely Dr
- 17 Pistol Creek Dr
- 953 Pinenut Ct
- 15635 Split Creek Dr
- 410 Palm Springs Way
- 15090 Ridgefield Ln
- 15628 Dawson Creek Dr
- 14785 Latrobe Dr
- 132 Kettle Valley Way
- 14925 Pristine Dr
- 15470 Paddington Cir
- 15490 Paddington Cir
- 15555 Holbein Dr
- 15545 Holbein Dr
- 15460 Paddington Cir
- 15565 Holbein Dr
- 15465 Paddington Cir
- 15535 Holbein Dr
- 15485 Paddington Cir
- 15495 Paddington Cir
- 15450 Paddington Cir
- 15525 Holbein Dr
- 15575 Jessie Dr
- 15583 Jessie Dr
- 15440 Paddington Cir
- 15585 Holbein Dr
- 15542 Jessie Dr
- 15385 Sostrin Ln
- 15515 Holbein Dr
- 15559 Jessie Dr