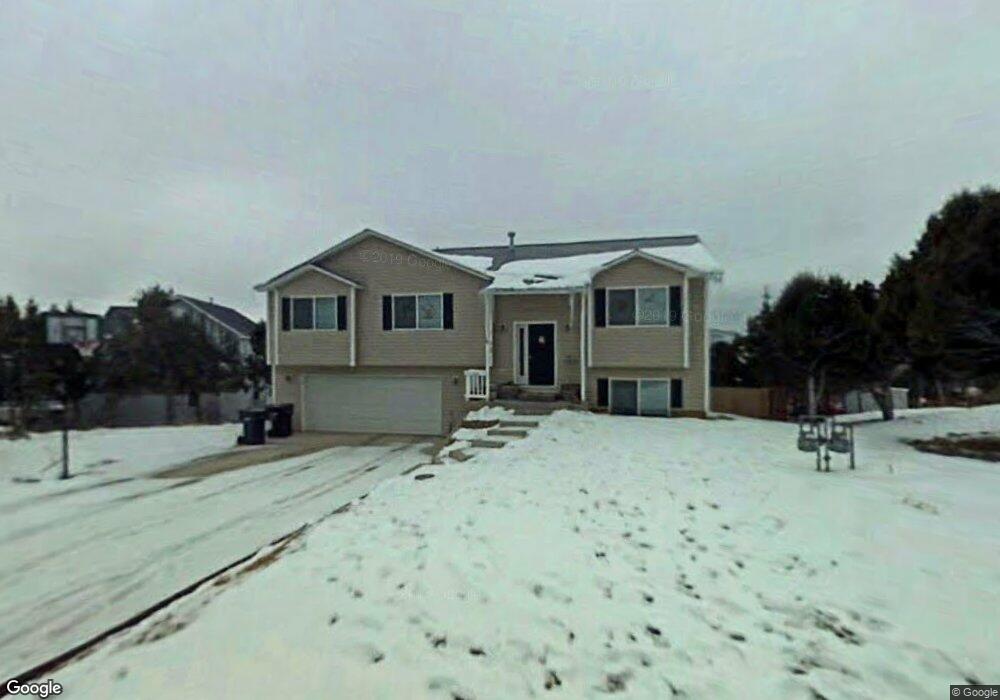
1549 Cholla St NE Bayfield, CO 81122
Estimated Value: $586,512 - $642,000
4
Beds
3
Baths
2,280
Sq Ft
$267/Sq Ft
Est. Value
About This Home
This home is located at 1549 Cholla St NE, Bayfield, CO 81122 and is currently estimated at $608,878, approximately $267 per square foot. 1549 Cholla St NE is a home located in La Plata County with nearby schools including Bayfield Elementary School, Bayfield Middle School, and Bayfield High School.
Ownership History
Date
Name
Owned For
Owner Type
Purchase Details
Closed on
Apr 25, 2019
Sold by
Speece Christina I and Speece Danny Lee
Bought by
Williams Brian and Williams Tammy
Current Estimated Value
Home Financials for this Owner
Home Financials are based on the most recent Mortgage that was taken out on this home.
Original Mortgage
$339,500
Outstanding Balance
$298,481
Interest Rate
4.3%
Mortgage Type
New Conventional
Estimated Equity
$310,397
Purchase Details
Closed on
Apr 28, 2006
Sold by
Boyer Brett and Boyer Katrina
Bought by
Speece Christina I and Speece Danny Lee
Home Financials for this Owner
Home Financials are based on the most recent Mortgage that was taken out on this home.
Original Mortgage
$74,900
Interest Rate
6.33%
Mortgage Type
Purchase Money Mortgage
Purchase Details
Closed on
Apr 21, 1994
Bought by
Speece Christina I and Speece Danny Lee
Create a Home Valuation Report for This Property
The Home Valuation Report is an in-depth analysis detailing your home's value as well as a comparison with similar homes in the area
Home Values in the Area
Average Home Value in this Area
Purchase History
| Date | Buyer | Sale Price | Title Company |
|---|---|---|---|
| Williams Brian | $350,000 | Land Title Guarantee Co | |
| Speece Christina I | $289,900 | Land Title | |
| Speece Christina I | $22,500 | -- |
Source: Public Records
Mortgage History
| Date | Status | Borrower | Loan Amount |
|---|---|---|---|
| Open | Williams Brian | $339,500 | |
| Previous Owner | Speece Christina I | $74,900 |
Source: Public Records
Tax History Compared to Growth
Tax History
| Year | Tax Paid | Tax Assessment Tax Assessment Total Assessment is a certain percentage of the fair market value that is determined by local assessors to be the total taxable value of land and additions on the property. | Land | Improvement |
|---|---|---|---|---|
| 2025 | $2,114 | $37,080 | $5,410 | $31,670 |
| 2024 | $1,933 | $30,850 | $3,710 | $27,140 |
| 2023 | $1,933 | $33,860 | $4,070 | $29,790 |
| 2022 | $1,813 | $27,660 | $3,810 | $23,850 |
| 2021 | $1,886 | $28,460 | $3,920 | $24,540 |
| 2020 | $1,872 | $29,080 | $3,770 | $25,310 |
| 2019 | $1,792 | $28,580 | $3,770 | $24,810 |
| 2018 | $1,391 | $22,570 | $4,430 | $18,140 |
| 2017 | $1,396 | $22,570 | $4,430 | $18,140 |
| 2016 | $1,338 | $21,560 | $4,770 | $16,790 |
| 2015 | $1,093 | $21,560 | $4,770 | $16,790 |
| 2014 | -- | $21,210 | $4,130 | $17,080 |
| 2013 | -- | $21,210 | $4,130 | $17,080 |
Source: Public Records
Map
Nearby Homes
- 782 E Cedar Dr
- 1200 N Oak Dr
- 590 N Wilmer Dr
- 1636 S Taylor Cir
- TBD N A
- 1607 S Taylor Cir
- 43189 Us Highway 160
- 103 Senica St
- 116 Senica St
- 107 Senica St
- 1317 County Road 501
- Lot 16 Primrose Ln
- Lot 15 Primrose Ln
- 1398 Kremer Dr
- 325 Star Crossing Unit 2
- 1354 Kremer Dr
- TBD Wolverine Dr
- 1591 County Road 526 Unit 2
- 1591 Cr 526 Unit 7
- 270 Sunflower Ln
- 0 N Cholla St Unit 747491
- 1571 N Cholla St
- 897 E Tamarack Dr
- 1571 Cholla St NE
- 812 Saguaro St
- 0 Saguaro St
- 815 Saguaro St
- 849 E Tamarack Dr
- 909 E Tamarack Dr
- 1583 N Cholla St
- 810 Saguaro St
- 904 E Tamarack Dr
- 807 Saguaro St
- 888 E Tamarack Dr
- 847 E Tamarack Dr
- 925 E Tamarack Dr
- 777 Saguaro St
- 630 Dove Ranch Rd Unit I
- 630 Dove Ranch Rd Unit Lot 1106
- 624 Dove Ranch Rd