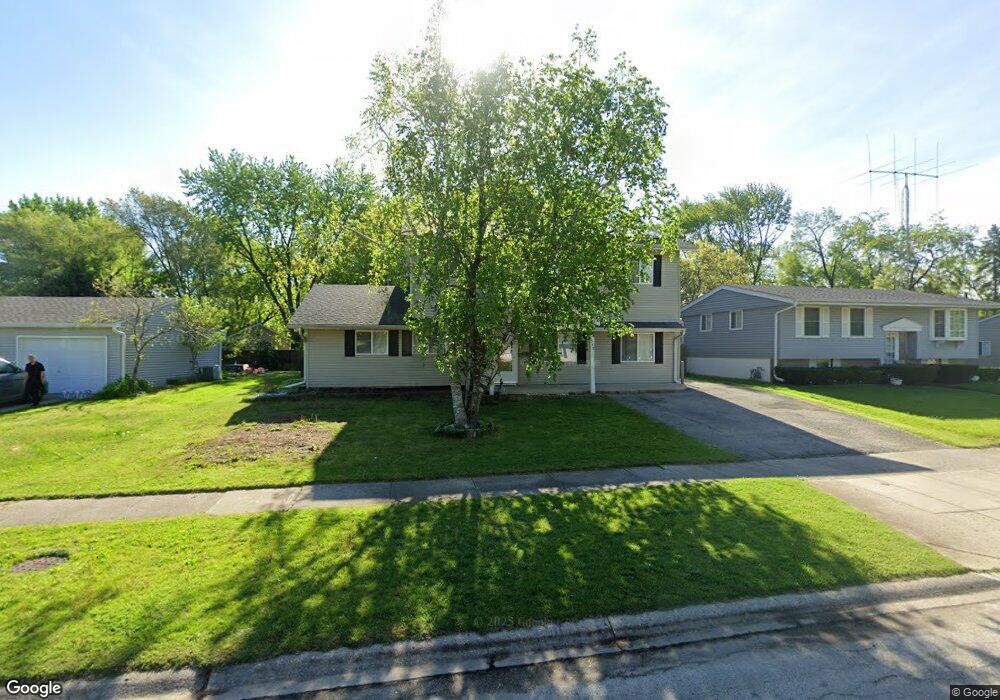
1549 Sandy Ln Unit 5 Aurora, IL 60506
North River NeighborhoodEstimated Value: $305,000 - $388,000
4
Beds
3
Baths
2,295
Sq Ft
$154/Sq Ft
Est. Value
About This Home
This home is located at 1549 Sandy Ln Unit 5, Aurora, IL 60506 and is currently estimated at $354,069, approximately $154 per square foot. 1549 Sandy Ln Unit 5 is a home located in Kane County with nearby schools including Fearn Elementary School, Jewel Middle School, and West Aurora High School.
Ownership History
Date
Name
Owned For
Owner Type
Purchase Details
Closed on
Apr 19, 2017
Sold by
White Charles
Bought by
Diaz Cruz A and Diaz Teresa V
Current Estimated Value
Home Financials for this Owner
Home Financials are based on the most recent Mortgage that was taken out on this home.
Original Mortgage
$154,660
Outstanding Balance
$128,841
Interest Rate
4.25%
Mortgage Type
FHA
Estimated Equity
$225,228
Purchase Details
Closed on
Feb 28, 2014
Sold by
White Danette
Bought by
White Charles
Purchase Details
Closed on
Sep 21, 1998
Sold by
Retterer Danette E
Bought by
White Charles D and White Danette E
Home Financials for this Owner
Home Financials are based on the most recent Mortgage that was taken out on this home.
Original Mortgage
$50,000
Interest Rate
6.99%
Purchase Details
Closed on
Apr 13, 1998
Sold by
Retterer David L and Retterer Danette
Bought by
Retterer Danette
Purchase Details
Closed on
Nov 16, 1996
Sold by
Aguilar Carolyn A
Bought by
Retterer David and Retterer Danette
Create a Home Valuation Report for This Property
The Home Valuation Report is an in-depth analysis detailing your home's value as well as a comparison with similar homes in the area
Home Values in the Area
Average Home Value in this Area
Purchase History
| Date | Buyer | Sale Price | Title Company |
|---|---|---|---|
| Diaz Cruz A | $190,000 | Chicago Title Insurance Co | |
| White Charles | $21,000 | None Available | |
| White Charles D | -- | First American Title Ins Co | |
| Retterer Danette | -- | -- | |
| Retterer David | $78,000 | Law Title Insurance Co Inc |
Source: Public Records
Mortgage History
| Date | Status | Borrower | Loan Amount |
|---|---|---|---|
| Open | Diaz Cruz A | $154,660 | |
| Previous Owner | White Charles D | $50,000 |
Source: Public Records
Tax History Compared to Growth
Tax History
| Year | Tax Paid | Tax Assessment Tax Assessment Total Assessment is a certain percentage of the fair market value that is determined by local assessors to be the total taxable value of land and additions on the property. | Land | Improvement |
|---|---|---|---|---|
| 2024 | $7,995 | $108,975 | $13,260 | $95,715 |
| 2023 | $7,655 | $97,369 | $11,848 | $85,521 |
| 2022 | $7,003 | $85,118 | $10,810 | $74,308 |
| 2021 | $6,692 | $79,246 | $10,064 | $69,182 |
| 2020 | $6,365 | $73,993 | $9,348 | $64,645 |
| 2019 | $7,377 | $81,441 | $8,661 | $72,780 |
| 2018 | $6,793 | $74,048 | $8,011 | $66,037 |
| 2017 | $6,307 | $67,281 | $7,381 | $59,900 |
| 2016 | $5,818 | $60,769 | $6,327 | $54,442 |
| 2015 | -- | $53,094 | $5,441 | $47,653 |
| 2014 | -- | $49,484 | $5,233 | $44,251 |
| 2013 | -- | $51,895 | $5,158 | $46,737 |
Source: Public Records
Map
Nearby Homes
- 1563 Cambridge Ave
- 1059 Scarlet Oak Cir
- 929 Southbridge Dr
- 910 Southbridge Dr
- 3 Lovedale Ln
- 1041 N Elmwood Dr
- 1069 Legrande Ave
- 307 John St
- 320 Harmony Dr
- 306 Harmony Dr
- 16 S Grace St
- 327 Lakelawn Blvd
- 563 California Ave
- 1045 Palace St
- 950 Pennsylvania Ave
- 43 S Juniper Dr Unit 3
- 6 S Sycamore Ln
- 24 S Grant St
- 12 N Lincolnway
- 342 Colorado Ave
- 1543 Sandy Ln
- 1555 Sandy Ln Unit 5
- 1539 Sandy Ln Unit 5
- 1542 Hollycrest Ave Unit 4
- 1546 Hollycrest Ave Unit 4
- 1565 Sandy Ln
- 1546 Sandy Ln
- 738 Calico Dr Unit 5
- 1552 Sandy Ln
- 1542 Sandy Ln Unit 5
- 1556 Sandy Ln Unit 5
- 725 Springbrook Dr
- 1531 Sandy Ln
- 739 Cloverdale Place
- 1536 Sandy Ln
- 754 Calico Dr
- 732 Calico Dr Unit 4
- 733 Cloverdale Place
- 721 Springbrook Dr
- 726 Calico Dr