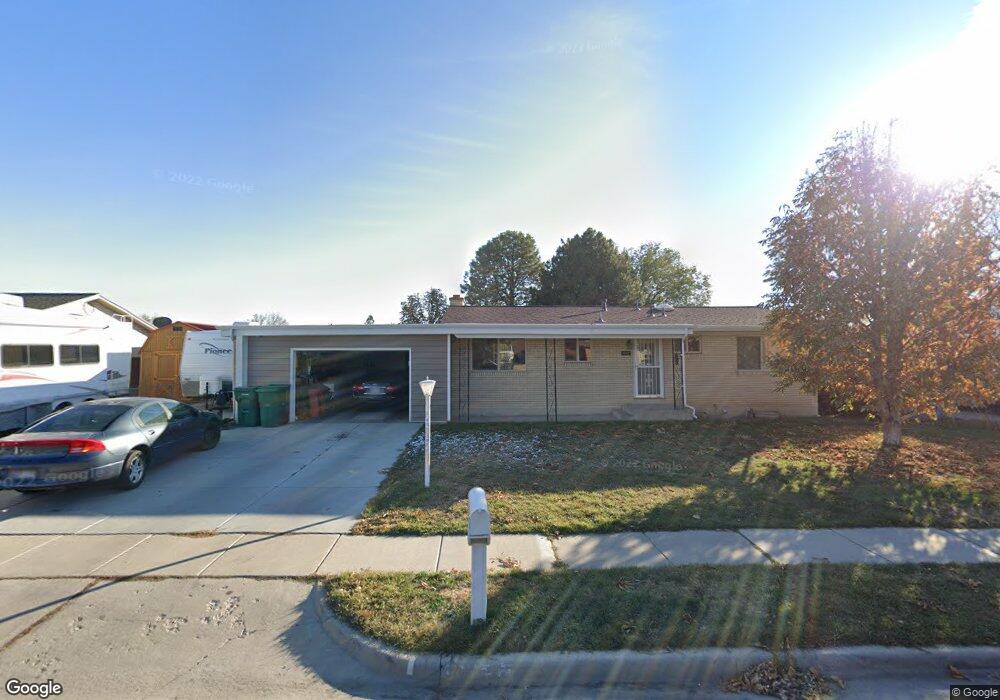
1549 W 1850 N Layton, UT 84041
Estimated Value: $397,000 - $469,000
3
Beds
2
Baths
1,120
Sq Ft
$383/Sq Ft
Est. Value
About This Home
This home is located at 1549 W 1850 N, Layton, UT 84041 and is currently estimated at $429,028, approximately $383 per square foot. 1549 W 1850 N is a home located in Davis County with nearby schools including Vae View Elementary School, North Layton Junior High School, and Northridge High School.
Create a Home Valuation Report for This Property
The Home Valuation Report is an in-depth analysis detailing your home's value as well as a comparison with similar homes in the area
Home Values in the Area
Average Home Value in this Area
Tax History Compared to Growth
Tax History
| Year | Tax Paid | Tax Assessment Tax Assessment Total Assessment is a certain percentage of the fair market value that is determined by local assessors to be the total taxable value of land and additions on the property. | Land | Improvement |
|---|---|---|---|---|
| 2025 | $2,070 | $217,250 | $106,001 | $111,249 |
| 2024 | $2,003 | $211,750 | $126,518 | $85,232 |
| 2023 | $1,937 | $361,000 | $163,395 | $197,605 |
| 2022 | $2,103 | $212,850 | $76,964 | $135,886 |
| 2021 | $1,954 | $295,000 | $109,982 | $185,018 |
| 2020 | $1,547 | $224,000 | $81,257 | $142,743 |
| 2019 | $1,537 | $218,000 | $78,134 | $139,866 |
| 2018 | $1,341 | $191,000 | $72,347 | $118,653 |
| 2016 | $1,165 | $85,580 | $20,654 | $64,926 |
| 2015 | $1,119 | $78,045 | $20,654 | $57,391 |
| 2014 | $1,169 | $83,386 | $20,654 | $62,732 |
| 2013 | -- | $71,868 | $18,612 | $53,256 |
Source: Public Records
Map
Nearby Homes
- 1748 N 1600 W
- 1740 N 1600 W Unit 116
- 1606 W 1960 N
- 1692 N 1600 W
- 1688 N 1600 W Unit 125
- 1682 N 1600 W
- 1678 N 1600 W
- 1668 N 1600 W
- 1664 N 1600 W
- 1650 N Main St Unit 126
- Highbridge 3 Plan at Layton Towns on Main - Townhomes
- Highbridge 1 Plan at Layton Towns on Main - Townhomes
- Midtown Plan at Layton Towns on Main - Townhomes
- Cityline 1 Plan at Layton Towns on Main - Townhomes
- Cityline 2 Plan at Layton Towns on Main - Townhomes
- 1654 N 1600 W
- 1652 N 1600 St W
- 1598 N Main St
- 1425 W 1650 N
- 1591 N Marilyn Dr
- 1531 W 1850 N
- 1561 W 1850 N
- 1807 N 1525 W
- 1818 N 1575 W
- 1552 W 1850 N
- 1534 W 1850 N
- 1515 W 1850 N
- 1800 N 1575 W
- 1810 N 1525 W
- 1785 N 1525 W
- 1564 W 1850 N
- 1516 W 1850 N
- 1564 Camelot Dr
- 1516 Camelot Dr
- 1782 N 1575 W
- 1497 Camelot Dr
- 1498 W 1850 N
- 1497 W 1850 N
- 1497 W 1850 N
- 1497 W 1850 N Unit Basement Apartment