15490 Waters Creek Dr Centreville, VA 20120
Estimated Value: $960,000 - $1,007,000
4
Beds
4
Baths
3,952
Sq Ft
$248/Sq Ft
Est. Value
About This Home
This home is located at 15490 Waters Creek Dr, Centreville, VA 20120 and is currently estimated at $981,282, approximately $248 per square foot. 15490 Waters Creek Dr is a home located in Fairfax County with nearby schools including Ormond Stone Middle School, Westfield High School, and Ad Fontes Academy.
Ownership History
Date
Name
Owned For
Owner Type
Purchase Details
Closed on
May 5, 2015
Sold by
Whippen Richard G
Bought by
Aguilar Raul O
Current Estimated Value
Home Financials for this Owner
Home Financials are based on the most recent Mortgage that was taken out on this home.
Original Mortgage
$596,700
Outstanding Balance
$459,843
Interest Rate
3.69%
Mortgage Type
New Conventional
Estimated Equity
$521,439
Purchase Details
Closed on
May 9, 2008
Sold by
Met Melissa E
Bought by
Whippen Richard G
Home Financials for this Owner
Home Financials are based on the most recent Mortgage that was taken out on this home.
Original Mortgage
$450,000
Interest Rate
5.93%
Mortgage Type
New Conventional
Purchase Details
Closed on
Apr 3, 1999
Sold by
Douglass Kurt D
Bought by
Pol James
Create a Home Valuation Report for This Property
The Home Valuation Report is an in-depth analysis detailing your home's value as well as a comparison with similar homes in the area
Home Values in the Area
Average Home Value in this Area
Purchase History
| Date | Buyer | Sale Price | Title Company |
|---|---|---|---|
| Aguilar Raul O | $663,000 | -- | |
| Whippen Richard G | $600,000 | -- | |
| Pol James | $340,000 | -- |
Source: Public Records
Mortgage History
| Date | Status | Borrower | Loan Amount |
|---|---|---|---|
| Open | Aguilar Raul O | $596,700 | |
| Previous Owner | Whippen Richard G | $450,000 |
Source: Public Records
Tax History Compared to Growth
Tax History
| Year | Tax Paid | Tax Assessment Tax Assessment Total Assessment is a certain percentage of the fair market value that is determined by local assessors to be the total taxable value of land and additions on the property. | Land | Improvement |
|---|---|---|---|---|
| 2025 | $9,385 | $867,670 | $302,000 | $565,670 |
| 2024 | $9,385 | $810,110 | $292,000 | $518,110 |
| 2023 | $9,011 | $798,470 | $292,000 | $506,470 |
| 2022 | $8,302 | $725,990 | $252,000 | $473,990 |
| 2021 | $7,424 | $632,650 | $242,000 | $390,650 |
| 2020 | $7,257 | $613,190 | $232,000 | $381,190 |
| 2019 | $7,067 | $597,110 | $226,000 | $371,110 |
| 2018 | $6,867 | $597,110 | $226,000 | $371,110 |
| 2017 | $6,932 | $597,110 | $226,000 | $371,110 |
| 2016 | $6,787 | $585,830 | $222,000 | $363,830 |
| 2015 | $6,752 | $604,980 | $222,000 | $382,980 |
| 2014 | $6,483 | $582,220 | $212,000 | $370,220 |
Source: Public Records
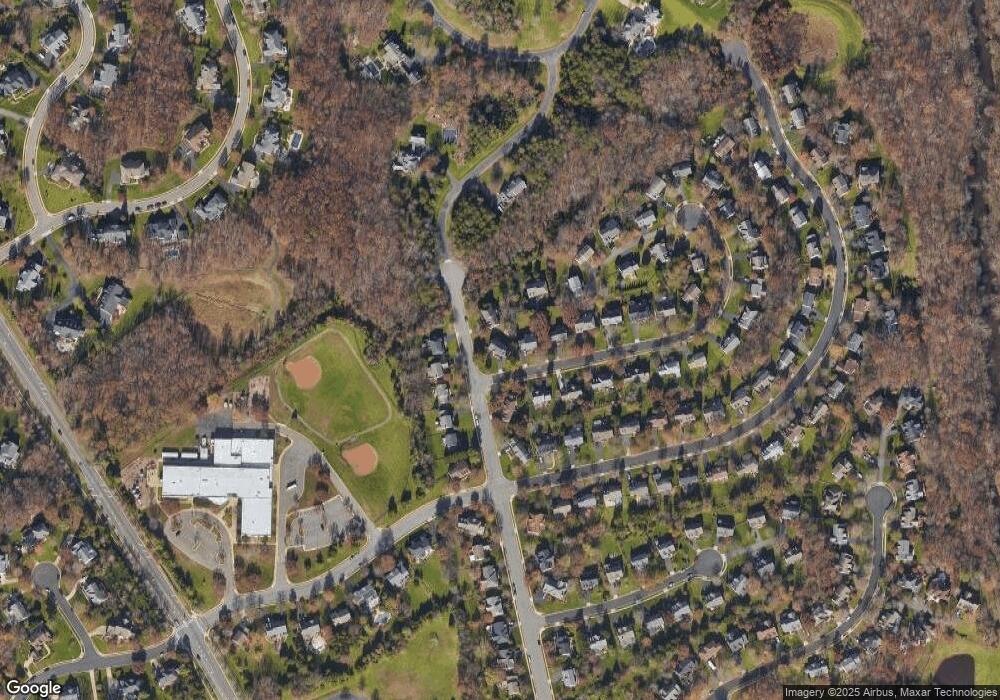
Map
Nearby Homes
- 15564 Smithfield Place
- 15277 Surrey House Way
- 15313 Surrey House Way
- 15303 Whispering Glen Ct
- 6501 Bull Run Woods Trail
- 6500 Bull Run Woods Trail
- 15513 Meherrin Dr
- 15470 Meherrin Dr
- 15120 Wetherburn Dr
- 15107 Wetherburn Dr
- 15409 Eagle Tavern Ln
- 14801 Carlbern Dr
- 15202 Wetherburn Dr
- 14855 Lynhodge Ct
- 13933-13937 Braddock Rd
- 14816 Lynhodge Ct
- 14812 Smethwick Place
- 14719 Winterfield Ct
- 14785 Green Park Way
- 14822 Millicent Ct
- 15488 Waters Creek Dr
- 6147 Ridgemont Dr
- 6157 Ridgemont Dr
- 15484 Waters Creek Dr
- 15486 Waters Creek Dr
- 6150 Ridgemont Dr
- 15485 Waters Creek Dr
- 6148 Ridgemont Dr
- 6152 Ridgemont Dr
- 6154 Ridgemont Dr
- 15483 Waters Creek Dr
- 15482 Waters Creek Dr
- 6159 Ridgemont Dr
- 6156 Ridgemont Dr
- 15436 Martins Hundred Dr
- 15466 Waters Creek Dr
- 15481 Waters Creek Dr
- 15434 Martins Hundred Dr
- 15480 Waters Creek Dr
- 15440 Martins Hundred Dr