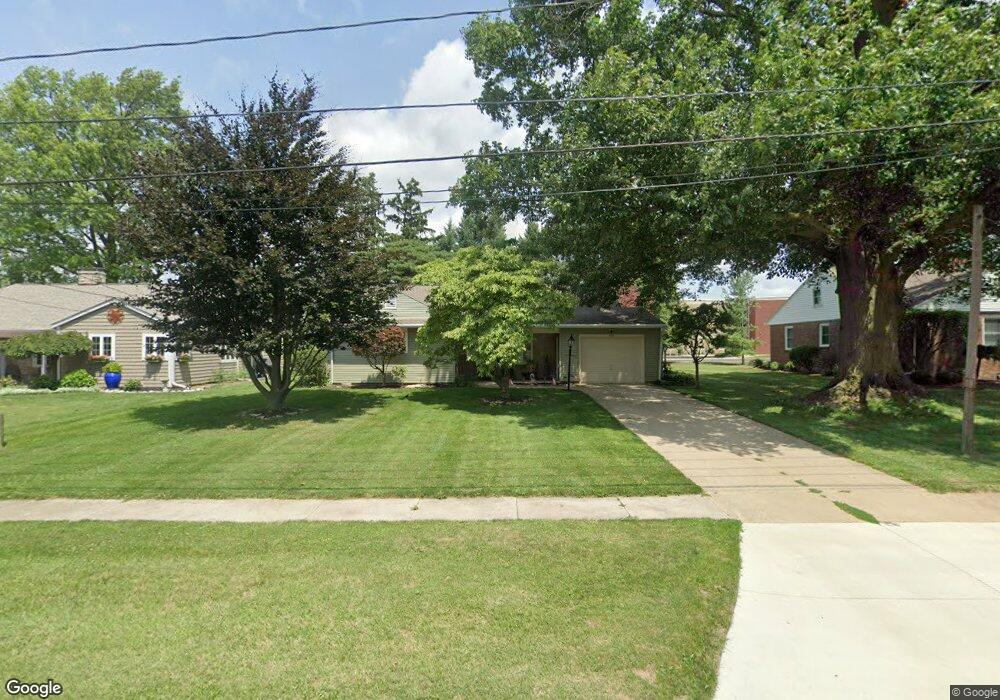
155 Aigler Blvd Bellevue, OH 44811
Estimated Value: $157,000 - $186,000
3
Beds
1
Bath
1,400
Sq Ft
$122/Sq Ft
Est. Value
About This Home
This home is located at 155 Aigler Blvd, Bellevue, OH 44811 and is currently estimated at $170,955, approximately $122 per square foot. 155 Aigler Blvd is a home located in Huron County with nearby schools including Bellevue Elementary School, Bellevue Middle School, and Bellevue High School.
Ownership History
Date
Name
Owned For
Owner Type
Purchase Details
Closed on
Oct 2, 2024
Sold by
Stape Betsy A
Bought by
Stape Betsy
Current Estimated Value
Home Financials for this Owner
Home Financials are based on the most recent Mortgage that was taken out on this home.
Original Mortgage
$229,500
Outstanding Balance
$200,943
Interest Rate
7.4%
Mortgage Type
Reverse Mortgage Home Equity Conversion Mortgage
Estimated Equity
-$29,988
Purchase Details
Closed on
Mar 27, 2019
Sold by
Estate Of Jacob J Stape
Bought by
Stape Betsy A
Purchase Details
Closed on
Sep 10, 1999
Bought by
Stape Jacob J
Purchase Details
Closed on
Jul 28, 1994
Sold by
Stape Jacob J
Bought by
Stape Jacob J and Stape Judith
Home Financials for this Owner
Home Financials are based on the most recent Mortgage that was taken out on this home.
Original Mortgage
$52,000
Interest Rate
8.41%
Mortgage Type
New Conventional
Create a Home Valuation Report for This Property
The Home Valuation Report is an in-depth analysis detailing your home's value as well as a comparison with similar homes in the area
Home Values in the Area
Average Home Value in this Area
Purchase History
| Date | Buyer | Sale Price | Title Company |
|---|---|---|---|
| Stape Betsy | -- | None Listed On Document | |
| Stape Betsy A | -- | None Available | |
| Stape Jacob J | -- | -- | |
| Stape Jacob J | $40,750 | -- | |
| Stape Jacob J | $40,800 | -- |
Source: Public Records
Mortgage History
| Date | Status | Borrower | Loan Amount |
|---|---|---|---|
| Open | Stape Betsy | $229,500 | |
| Closed | Stape Betsy | $229,500 | |
| Previous Owner | Stape Jacob J | $52,000 |
Source: Public Records
Tax History Compared to Growth
Tax History
| Year | Tax Paid | Tax Assessment Tax Assessment Total Assessment is a certain percentage of the fair market value that is determined by local assessors to be the total taxable value of land and additions on the property. | Land | Improvement |
|---|---|---|---|---|
| 2024 | $1,813 | $54,340 | $8,320 | $46,020 |
| 2023 | $1,813 | $38,710 | $6,010 | $32,700 |
| 2022 | $1,293 | $38,710 | $6,010 | $32,700 |
| 2021 | $1,304 | $38,710 | $6,010 | $32,700 |
| 2020 | $1,288 | $36,710 | $6,010 | $30,700 |
| 2019 | $1,270 | $36,710 | $6,010 | $30,700 |
| 2018 | $1,253 | $36,710 | $6,010 | $30,700 |
| 2017 | $1,026 | $32,250 | $5,780 | $26,470 |
| 2016 | $1,002 | $32,250 | $5,780 | $26,470 |
| 2015 | $1,024 | $32,250 | $5,780 | $26,470 |
| 2014 | $1,301 | $37,740 | $5,780 | $31,960 |
| 2013 | $1,481 | $37,740 | $5,780 | $31,960 |
Source: Public Records
Map
Nearby Homes
- 819 Castalia St
- 124 Sunset Dr
- 808 Castalia St
- 303 Moore Ave
- 130 Huffman St
- 219 Huffman St
- 126 Greenwood Heights
- 408 W Main St
- 140 Harkness St
- 206 Southwest St
- 129 Hamilton St
- 501 E Center St
- 817 E Main St
- 118 Maplewood
- 231 Lawrence St
- 154 Ashford Ave
- 0 Oakwood Dr
- 150 Redwood Dr
- 230 Highland Ave Unit 106
- 155 Ashford Ave
- 159 Aigler Blvd
- 151 Aigler Blvd
- 145 Aigler Blvd
- 925 Castalia St
- 158 Aigler Blvd
- 156 Aigler Blvd
- 1009 Castalia St
- 150 Aigler Blvd
- 923 Castalia St
- 146 Aigler Blvd
- 921 Castalia St
- 133 Aigler Blvd
- 917 Castalia St
- 140 Aigler Blvd
- 159 William Ave
- 127 Aigler Blvd
- 155 William Ave
- 136 Aigler Blvd
- 151 William Ave
- 903 Castalia St