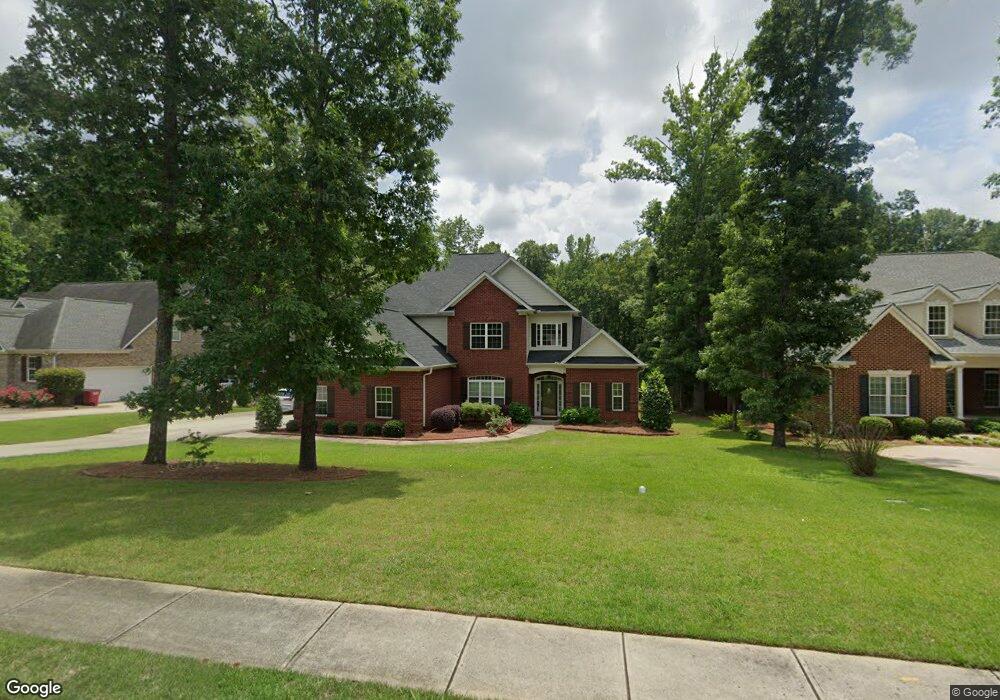
155 Broadleaf Dr Macon, GA 31210
Estimated Value: $649,000 - $678,000
Studio
--
Bath
4,177
Sq Ft
$158/Sq Ft
Est. Value
About This Home
This home is located at 155 Broadleaf Dr, Macon, GA 31210 and is currently estimated at $660,911, approximately $158 per square foot. 155 Broadleaf Dr is a home with nearby schools including Carter Elementary School, Howard Middle School, and Howard High School.
Ownership History
Date
Name
Owned For
Owner Type
Purchase Details
Closed on
Jan 15, 2016
Sold by
Rdg Ventures Llc
Bought by
Rongala Venkata S
Current Estimated Value
Home Financials for this Owner
Home Financials are based on the most recent Mortgage that was taken out on this home.
Original Mortgage
$353,600
Outstanding Balance
$148,343
Interest Rate
3.99%
Mortgage Type
New Conventional
Estimated Equity
$512,568
Purchase Details
Closed on
Jun 22, 2015
Sold by
Equitable Real Estate Services Inc
Bought by
Rdg Ventures Inc
Home Financials for this Owner
Home Financials are based on the most recent Mortgage that was taken out on this home.
Original Mortgage
$354,000
Interest Rate
3.89%
Mortgage Type
Construction
Purchase Details
Closed on
Sep 22, 2004
Sold by
Fielbon Development Co Llc
Bought by
Equitable Real Est Svcs Inc
Create a Home Valuation Report for This Property
The Home Valuation Report is an in-depth analysis detailing your home's value as well as a comparison with similar homes in the area
Purchase History
| Date | Buyer | Sale Price | Title Company |
|---|---|---|---|
| Rongala Venkata S | $442,000 | -- | |
| Rdg Ventures Inc | $65,000 | None Available | |
| Equitable Real Estate Services Inc | -- | None Available | |
| Equitable Real Est Svcs Inc | $531,000 | -- |
Source: Public Records
Mortgage History
| Date | Status | Borrower | Loan Amount |
|---|---|---|---|
| Open | Rongala Venkata S | $353,600 | |
| Previous Owner | Equitable Real Estate Services Inc | $354,000 |
Source: Public Records
Tax History
| Year | Tax Paid | Tax Assessment Tax Assessment Total Assessment is a certain percentage of the fair market value that is determined by local assessors to be the total taxable value of land and additions on the property. | Land | Improvement |
|---|---|---|---|---|
| 2025 | $6,896 | $287,609 | $20,000 | $267,609 |
| 2024 | $6,775 | $273,767 | $20,000 | $253,767 |
| 2023 | $5,732 | $250,697 | $20,000 | $230,697 |
| 2022 | $6,533 | $195,695 | $25,232 | $170,463 |
| 2021 | $7,010 | $191,473 | $24,320 | $167,153 |
| 2020 | $6,776 | $181,543 | $24,320 | $157,223 |
| 2019 | $6,832 | $181,543 | $24,320 | $157,223 |
| 2018 | $10,644 | $181,543 | $24,320 | $157,223 |
| 2017 | $6,624 | $181,543 | $24,320 | $157,223 |
| 2016 | $3,776 | $109,137 | $24,320 | $84,817 |
| 2015 | $518 | $10,579 | $10,579 | $0 |
| 2014 | $173 | $10,579 | $10,579 | $0 |
Source: Public Records
Map
Nearby Homes
- 103 Howard Oaks Dr
- 732 Bass Rd
- 108 Manor Terrace
- 128 Wolf Creek Dr N
- 157 Camden Trace
- 153 Camden Trace
- 109 Camden Trace
- 100 Trillium Terrace
- 152 Camden Trace
- 118 Ashford Park
- 106 Lagrange Place
- 218 Sanders Rd
- 173 Sanders Rd
- 6368 Old Forsyth Rd
- 113 Manor Row
- 205 Camden Trace
- 180 Autumn Trace Ct
- 140 Senora Place
- 139 Ashford Trace Ln
- 104 Saint Thomas Place
- 202 Oakleaf Dr
- 151 Broadleaf Dr
- 157 Broadleaf Dr
- 204 Oakleaf Dr
- 161 Broadleaf Dr
- 201 Oakleaf Dr
- 142 Broadleaf Dr
- 203 Oakleaf Dr
- 206 Oakleaf Dr
- 140 Broadleaf Dr
- 207 Oakleaf Dr
- 145 Broadleaf Dr
- 5892 Huddersfield Rd
- 164 Broadleaf Dr
- 165 Broadleaf Dr
- 5886 Huddersfield Rd
- 136 Broadleaf Dr
- 209 Oakleaf Dr
- 214 Oakleaf Dr
- 141 Broadleaf Dr
Your Personal Tour Guide
Ask me questions while you tour the home.