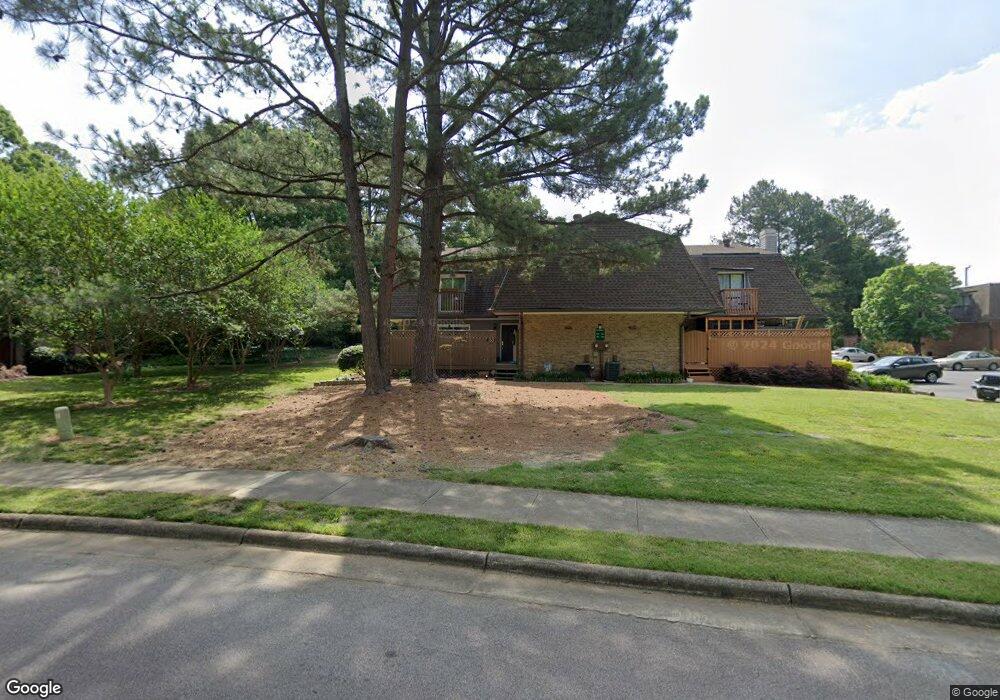
155 Brookberry Cir Unit 155 Chapel Hill, NC 27517
Estimated Value: $292,096 - $331,000
2
Beds
3
Baths
1,227
Sq Ft
$258/Sq Ft
Est. Value
About This Home
This home is located at 155 Brookberry Cir Unit 155, Chapel Hill, NC 27517 and is currently estimated at $316,774, approximately $258 per square foot. 155 Brookberry Cir Unit 155 is a home located in Durham County with nearby schools including Creekside Elementary School, Morehead Montessori, and Sherwood Githens Middle.
Ownership History
Date
Name
Owned For
Owner Type
Purchase Details
Closed on
Jun 22, 2007
Sold by
Thorsten Vanessa and Thorsten Richard
Bought by
Parker Ronald and Parker Cora
Current Estimated Value
Purchase Details
Closed on
Mar 31, 2004
Sold by
Whitaker Michael Keith and Whitaker Natalie
Bought by
Rommelman Vanessa
Home Financials for this Owner
Home Financials are based on the most recent Mortgage that was taken out on this home.
Original Mortgage
$116,100
Interest Rate
3.75%
Mortgage Type
Purchase Money Mortgage
Purchase Details
Closed on
Feb 23, 2001
Sold by
Moore Lydia M
Bought by
Whitaker Michael Keith
Home Financials for this Owner
Home Financials are based on the most recent Mortgage that was taken out on this home.
Original Mortgage
$112,277
Interest Rate
6.91%
Mortgage Type
FHA
Create a Home Valuation Report for This Property
The Home Valuation Report is an in-depth analysis detailing your home's value as well as a comparison with similar homes in the area
Home Values in the Area
Average Home Value in this Area
Purchase History
| Date | Buyer | Sale Price | Title Company |
|---|---|---|---|
| Parker Ronald | $170,000 | None Available | |
| Rommelman Vanessa | $129,000 | -- | |
| Whitaker Michael Keith | $116,000 | -- |
Source: Public Records
Mortgage History
| Date | Status | Borrower | Loan Amount |
|---|---|---|---|
| Previous Owner | Rommelman Vanessa | $116,100 | |
| Previous Owner | Whitaker Michael Keith | $112,277 |
Source: Public Records
Tax History Compared to Growth
Tax History
| Year | Tax Paid | Tax Assessment Tax Assessment Total Assessment is a certain percentage of the fair market value that is determined by local assessors to be the total taxable value of land and additions on the property. | Land | Improvement |
|---|---|---|---|---|
| 2025 | $3,230 | $293,301 | $0 | $293,301 |
| 2024 | $1,952 | $140,393 | $0 | $140,393 |
| 2023 | $1,859 | $140,393 | $0 | $140,393 |
| 2022 | $1,747 | $140,393 | $0 | $140,393 |
| 2021 | $1,736 | $140,393 | $0 | $140,393 |
| 2020 | $1,764 | $140,393 | $0 | $140,393 |
| 2019 | $1,764 | $140,393 | $0 | $140,393 |
| 2018 | $1,671 | $127,988 | $0 | $127,988 |
| 2017 | $1,633 | $127,988 | $0 | $127,988 |
| 2016 | $1,618 | $127,988 | $0 | $127,988 |
| 2015 | $2,141 | $162,584 | $0 | $162,584 |
| 2014 | -- | $162,584 | $0 | $162,584 |
Source: Public Records
Map
Nearby Homes
- 167 Springberry Ln Unit 167
- 294 Summerwalk Cir Unit 294
- 168 Summerwalk Cir Unit 168
- 249 Summerwalk Cir
- 261 Summerwalk Cir
- 320 Summerwalk Cir
- 449 Summerwalk Cir
- 47 Abernathy Dr Unit 13
- 1010 Kingswood Dr Unit B
- 1002 Kingswood Dr Unit H
- 112 Weaver Mine Trail
- 1233 Cranebridge Place
- 245 N Crest Dr
- 212 Old Barn Ln
- 2117 Carriage Way
- 1401 Oak Tree Dr
- 3408 Environ Way
- 903 Oak Tree Dr Unit 903
- 2210 Environ Way
- 2202 Environ Way Unit Bldg 2000
- 151 Brookberry Cir Unit 151
- 149 Brookberry Cir
- 149 Brookberry Cir Unit 149
- 149 Brookberry Cir Unit 149
- 147 Brookberry Cir Unit 147
- 145 Brookberry Cir Unit 145
- 143 Brookberry Cir Unit 143
- 145 Brookberry Cir Unit n/a
- 145 Brookberry Cir
- 141 Brookberry Cir Unit 141
- 141 Brookberry Cir
- 260 Brookberry Cir Unit 260
- 264 Brookberry Cir
- 266 Brookberry Cir Unit 266
- 266 Brookberry Cir
- 266 Brookberry Cir
- 266 Brookberry Cir
- 262 Brookberry Cir Unit 262
- 262 Brookberry Cir Unit 262
- 262 Brookberry Cir