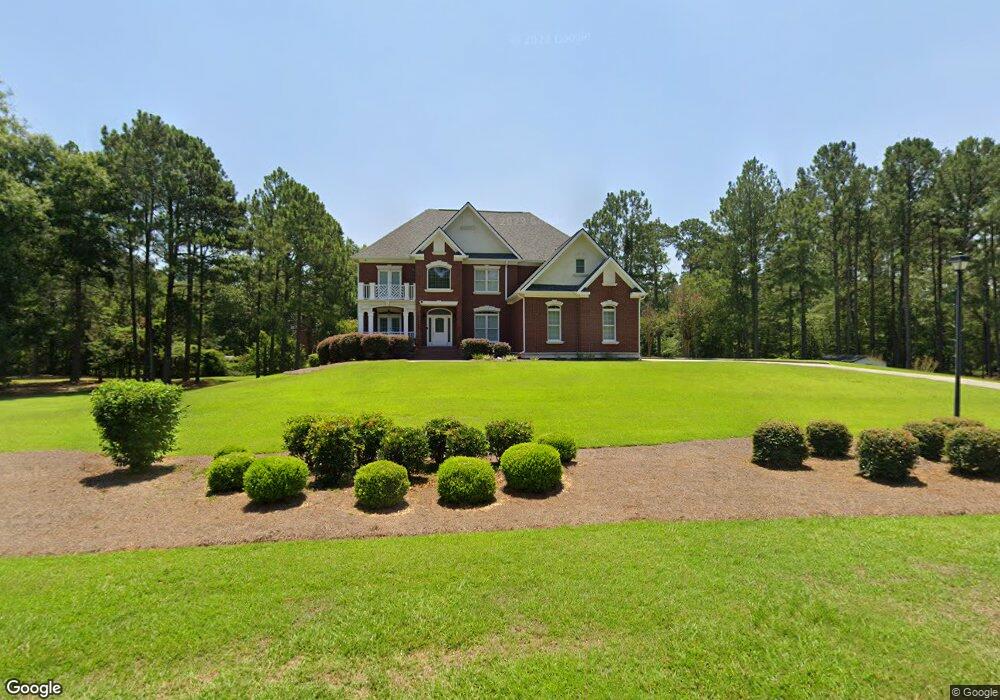
155 Carson Dr Cordele, GA 31015
Estimated Value: $477,000 - $771,000
6
Beds
6
Baths
5,240
Sq Ft
$116/Sq Ft
Est. Value
About This Home
This home is located at 155 Carson Dr, Cordele, GA 31015 and is currently estimated at $605,551, approximately $115 per square foot. 155 Carson Dr is a home located in Crisp County with nearby schools including Crisp County Elementary School, Crisp County Primary School, and Crisp County Middle School.
Ownership History
Date
Name
Owned For
Owner Type
Purchase Details
Closed on
Aug 15, 2014
Sold by
Boreland Samantha
Bought by
Boreland Samantha and Boreland Kermit
Current Estimated Value
Purchase Details
Closed on
Jan 1, 2012
Sold by
Prince Ryan F and Prince Karen J
Bought by
Prince Ryan F and Prince Karen J
Purchase Details
Closed on
Jan 1, 2011
Sold by
Prince Ryan F and Prince Karen J
Bought by
Prince Ryan F and Prince Karen J
Purchase Details
Closed on
Jul 2, 2010
Sold by
Prince Ryan F
Bought by
Taylor Tiffany B
Purchase Details
Closed on
Jan 1, 2010
Sold by
Prince Ryan F and Prince Karen J
Bought by
Prince Ryan F and Prince Karen J
Purchase Details
Closed on
Jun 5, 2006
Sold by
Floyd Johnny W
Bought by
Prince Ryan F and Prince Karen J
Purchase Details
Closed on
Mar 21, 2006
Sold by
Prince Ryan F
Bought by
Prince Ryan F and Prince Karen J
Purchase Details
Closed on
May 25, 1999
Sold by
Floyd John W
Bought by
Maniklal Kirti P
Create a Home Valuation Report for This Property
The Home Valuation Report is an in-depth analysis detailing your home's value as well as a comparison with similar homes in the area
Purchase History
| Date | Buyer | Sale Price | Title Company |
|---|---|---|---|
| Boreland Samantha | -- | -- | |
| Boreland Samantha | $386,900 | -- | |
| Prince Ryan F | $486,000 | -- | |
| Prince Ryan F | $486,000 | -- | |
| Taylor Tiffany B | -- | -- | |
| Prince Ryan F | $498,000 | -- | |
| Prince Ryan F | $20,000 | -- | |
| Prince Ryan F | -- | -- | |
| Prince Ryan F | $380,000 | -- | |
| Maniklal Kirti P | $20,000 | -- |
Source: Public Records
Mortgage History
| Date | Status | Borrower | Loan Amount |
|---|---|---|---|
| Closed | Prince Ryan F | $0 |
Source: Public Records
Tax History
| Year | Tax Paid | Tax Assessment Tax Assessment Total Assessment is a certain percentage of the fair market value that is determined by local assessors to be the total taxable value of land and additions on the property. | Land | Improvement |
|---|---|---|---|---|
| 2025 | $5,579 | $210,420 | $6,000 | $204,420 |
| 2024 | $5,243 | $193,657 | $6,000 | $187,657 |
| 2023 | $5,245 | $186,758 | $6,000 | $180,758 |
| 2022 | $5,009 | $178,378 | $6,000 | $172,378 |
| 2021 | $5,041 | $169,997 | $6,000 | $163,997 |
| 2020 | $5,083 | $173,164 | $6,000 | $167,164 |
| 2019 | $5,110 | $173,164 | $6,000 | $167,164 |
| 2018 | $4,952 | $161,714 | $8,000 | $153,714 |
| 2017 | $4,891 | $159,047 | $8,000 | $151,047 |
| 2016 | $4,884 | $159,047 | $8,000 | $151,047 |
| 2015 | -- | $159,047 | $8,000 | $151,047 |
| 2014 | -- | $159,047 | $8,000 | $151,047 |
| 2013 | -- | $159,046 | $8,000 | $151,046 |
Source: Public Records
Map
Nearby Homes
- 2032 Royal Rd
- 304 Timberland Dr
- 2115 Royal Rd
- 157 Bobwhite Dr
- 1018 E 28th Ave
- 1603 Pine Acres Dr
- 1410 E 24th Ave
- 1506 E 24th Ave
- 615 E 28th Ave
- 618 E 27th Ave
- 120 Edgewood Dr
- 614 E 26th Ave
- 2298 U S 41
- 1304 Robin St
- E 8th Ave
- 912 Rose Ln
- 1001 Stewart Ave
- 0 Pecan St S
- 2326 Joe Wright Dr
- 1509 E 20th Ave
- 510 Timberland Dr
- 602 Timberland Dr
- 141 Carson Dr
- 117 Loblolly St
- 6 Carson Dr
- 5 Carson Dr
- 508 Timberland Dr
- Lot 5 N Timberland Blk A
- Lot 6 N Timberland Blk A
- 103 Loblolly St
- 177 Carson Dr
- 601 Timberland Dr
- 113 Timberland Dr
- 506 Timberland Dr
- Lot 6 Carson Dr
- Lot 5 Carson Dr
- 0 Carson Dr
- 111 Timberland Dr
- 102 Slash Cir
- 603 Timberland Dr