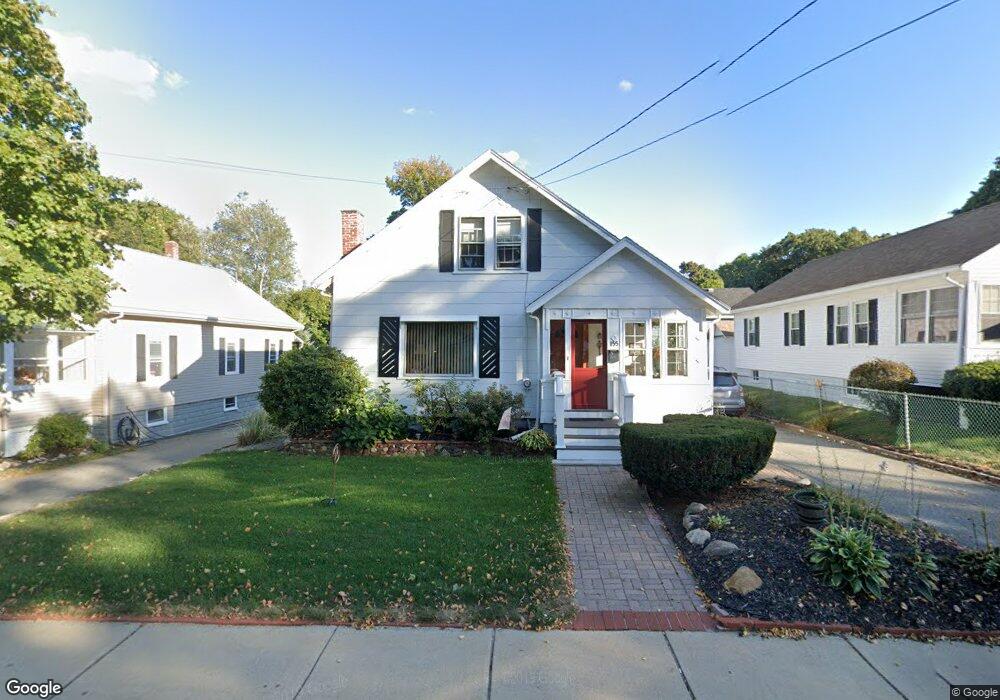
155 Elm St Stoneham, MA 02180
Colonial Park NeighborhoodEstimated Value: $673,000 - $984,000
2
Beds
1
Bath
1,774
Sq Ft
$437/Sq Ft
Est. Value
About This Home
This home is located at 155 Elm St, Stoneham, MA 02180 and is currently estimated at $774,810, approximately $436 per square foot. 155 Elm St is a home located in Middlesex County with nearby schools including Stoneham High School, St Joseph School, and St. Patrick Elementary School.
Ownership History
Date
Name
Owned For
Owner Type
Purchase Details
Closed on
Dec 18, 2025
Sold by
Reardon Louise A
Bought by
Louise A Reardon Irt and Reardon
Current Estimated Value
Purchase Details
Closed on
Aug 27, 2001
Sold by
Devincenzo Ft and Divencenzo
Bought by
Banelis Eric P and Banelis Louise A
Home Financials for this Owner
Home Financials are based on the most recent Mortgage that was taken out on this home.
Original Mortgage
$125,000
Interest Rate
7.21%
Mortgage Type
Purchase Money Mortgage
Create a Home Valuation Report for This Property
The Home Valuation Report is an in-depth analysis detailing your home's value as well as a comparison with similar homes in the area
Home Values in the Area
Average Home Value in this Area
Purchase History
| Date | Buyer | Sale Price | Title Company |
|---|---|---|---|
| Louise A Reardon Irt | -- | -- | |
| Banelis Eric P | $260,000 | -- |
Source: Public Records
Mortgage History
| Date | Status | Borrower | Loan Amount |
|---|---|---|---|
| Previous Owner | Banelis Eric P | $120,000 | |
| Previous Owner | Banelis Eric P | $125,000 |
Source: Public Records
Tax History
| Year | Tax Paid | Tax Assessment Tax Assessment Total Assessment is a certain percentage of the fair market value that is determined by local assessors to be the total taxable value of land and additions on the property. | Land | Improvement |
|---|---|---|---|---|
| 2025 | $5,962 | $582,800 | $332,500 | $250,300 |
| 2024 | $5,850 | $552,400 | $306,300 | $246,100 |
| 2023 | $5,840 | $526,100 | $280,000 | $246,100 |
| 2022 | $5,053 | $485,400 | $253,800 | $231,600 |
| 2021 | $11,535 | $442,500 | $218,800 | $223,700 |
| 2020 | $4,625 | $428,600 | $204,000 | $224,600 |
| 2019 | $4,504 | $401,400 | $198,000 | $203,400 |
| 2018 | $9,685 | $372,000 | $187,000 | $185,000 |
| 2017 | $4,333 | $349,700 | $168,000 | $181,700 |
| 2016 | $3,797 | $299,000 | $168,000 | $131,000 |
| 2015 | $3,555 | $274,300 | $152,000 | $122,300 |
| 2014 | $3,626 | $268,800 | $136,000 | $132,800 |
Source: Public Records
Map
Nearby Homes
- 3 Valley Rd
- 11 Valdora Dr
- 58 Washington St
- 4 Garfield Ave
- 35 Tremont St
- 62 High St Unit Lot 8
- 62 High St Unit 4
- 62 High St Unit Lot 5
- 62 High St Unit Lot 12
- 55 Bartley St
- 21 Tremont St Unit B
- 21 Tremont St Unit A
- 8 Steele St
- 51 Spring St
- 1 Tremont St
- 248 Albion St Unit 231
- 248 Albion St Unit 321
- 159 Main St Unit 27C
- 159 Main St Unit 39A
- 98 Main St Unit 2
Your Personal Tour Guide
Ask me questions while you tour the home.