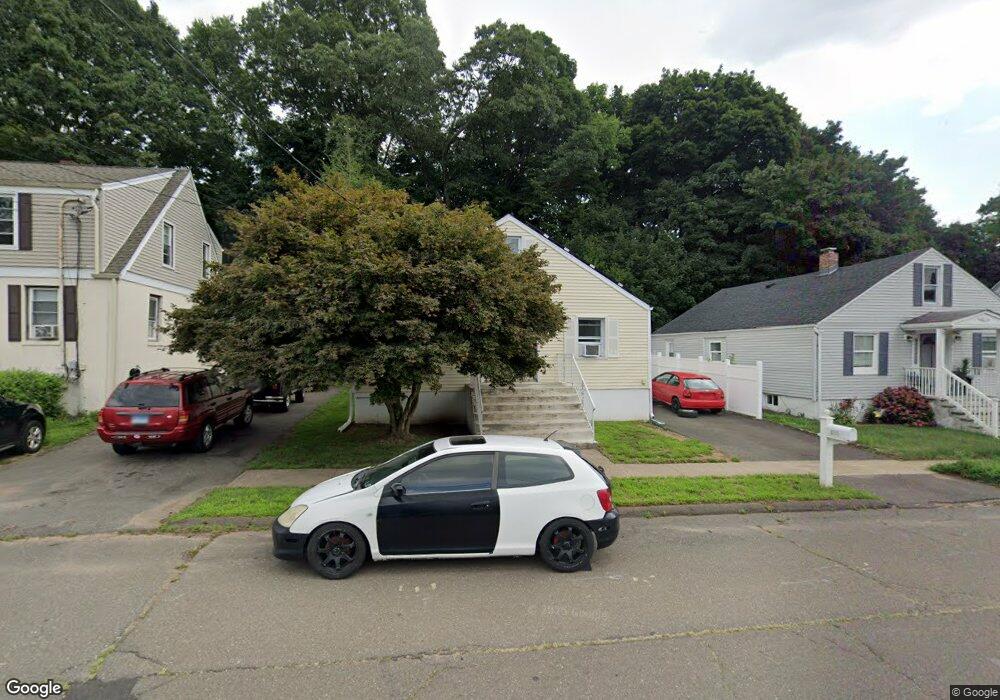
155 Foxon Blvd East Haven, CT 06513
Estimated Value: $304,800 - $367,000
3
Beds
1
Bath
1,125
Sq Ft
$297/Sq Ft
Est. Value
About This Home
This home is located at 155 Foxon Blvd, East Haven, CT 06513 and is currently estimated at $333,700, approximately $296 per square foot. 155 Foxon Blvd is a home located in New Haven County with nearby schools including Deer Run School, East Haven High School, and All Nations Christian Academy.
Ownership History
Date
Name
Owned For
Owner Type
Purchase Details
Closed on
May 29, 2009
Sold by
Friendship Properties
Bought by
Figueroa Indira
Current Estimated Value
Home Financials for this Owner
Home Financials are based on the most recent Mortgage that was taken out on this home.
Original Mortgage
$174,284
Outstanding Balance
$110,708
Interest Rate
4.87%
Estimated Equity
$222,992
Purchase Details
Closed on
Jan 9, 2009
Sold by
Lasalle Bank Na
Bought by
Friendship Properties
Purchase Details
Closed on
Aug 31, 1998
Sold by
Luedee Charles P and Luedee Laurie
Bought by
Sherwood Donald F and Sherwood Dawn M
Home Financials for this Owner
Home Financials are based on the most recent Mortgage that was taken out on this home.
Original Mortgage
$55,600
Interest Rate
2.5%
Mortgage Type
Unknown
Purchase Details
Closed on
Jan 20, 1994
Sold by
Franco Lena C
Bought by
Luedee Laurie and Luedee Charles P
Create a Home Valuation Report for This Property
The Home Valuation Report is an in-depth analysis detailing your home's value as well as a comparison with similar homes in the area
Home Values in the Area
Average Home Value in this Area
Purchase History
| Date | Buyer | Sale Price | Title Company |
|---|---|---|---|
| Figueroa Indira | $177,500 | -- | |
| Friendship Properties | $78,000 | -- | |
| Sherwood Donald F | $69,500 | -- | |
| Luedee Laurie | $62,000 | -- |
Source: Public Records
Mortgage History
| Date | Status | Borrower | Loan Amount |
|---|---|---|---|
| Open | Luedee Laurie | $174,284 | |
| Previous Owner | Luedee Laurie | $150,000 | |
| Previous Owner | Luedee Laurie | $75,000 | |
| Previous Owner | Luedee Laurie | $55,600 |
Source: Public Records
Tax History Compared to Growth
Tax History
| Year | Tax Paid | Tax Assessment Tax Assessment Total Assessment is a certain percentage of the fair market value that is determined by local assessors to be the total taxable value of land and additions on the property. | Land | Improvement |
|---|---|---|---|---|
| 2025 | $4,178 | $124,950 | $41,160 | $83,790 |
| 2024 | $4,178 | $124,950 | $41,160 | $83,790 |
| 2023 | $3,898 | $124,950 | $41,160 | $83,790 |
| 2022 | $3,898 | $124,950 | $41,160 | $83,790 |
| 2021 | $3,481 | $101,630 | $34,300 | $67,330 |
| 2020 | $3,481 | $101,630 | $34,300 | $67,330 |
| 2019 | $3,295 | $101,630 | $34,300 | $67,330 |
| 2018 | $3,298 | $101,630 | $34,300 | $67,330 |
| 2017 | $3,077 | $97,530 | $34,300 | $63,230 |
| 2016 | $3,770 | $119,480 | $37,730 | $81,750 |
| 2015 | $3,770 | $119,480 | $37,730 | $81,750 |
| 2014 | $3,829 | $119,480 | $37,730 | $81,750 |
Source: Public Records
Map
Nearby Homes
- 90 Foxon Blvd
- 300 Foxon Hill Rd
- 1445 Quinnipiac Ave
- 24 Laura Cir
- 1423 Quinnipiac Ave Unit 808
- 1423 Quinnipiac Ave Unit 709
- 1423 Quinnipiac Ave Unit 108
- 1423 Quinnipiac Ave Unit 602
- 29 Melrose Dr
- 30 Thompson St
- 173 Russo Ave Unit 409
- 173 Russo Ave Unit 609
- 173 Russo Ave Unit 410
- 66 John St
- 5 Assumption St
- 15 Glen Haven Rd
- 81 Melrose Dr
- 1706 Quinnipiac Ave
- 52 Glen Haven Rd
- 15 Cedar Ct Unit G
- 151 Foxon Blvd
- 167 Foxon Blvd Unit 30B
- 167 Foxon Blvd Unit 2
- 147 Foxon Blvd
- 120 Highland Ave
- 169 Foxon Blvd
- 114 Highland Ave
- 124 Highland Ave
- 143 Foxon Blvd
- 110 Highland Ave
- 170 Foxon Blvd
- 141 Foxon Blvd
- 172 Foxon Blvd
- 148 Foxon Blvd
- 146 Foxon Blvd
- 104 Highland Ave
- 185 Foxon Blvd
- 121 Highland Ave
- 137 Old Foxon Rd
- 125 Highland Ave