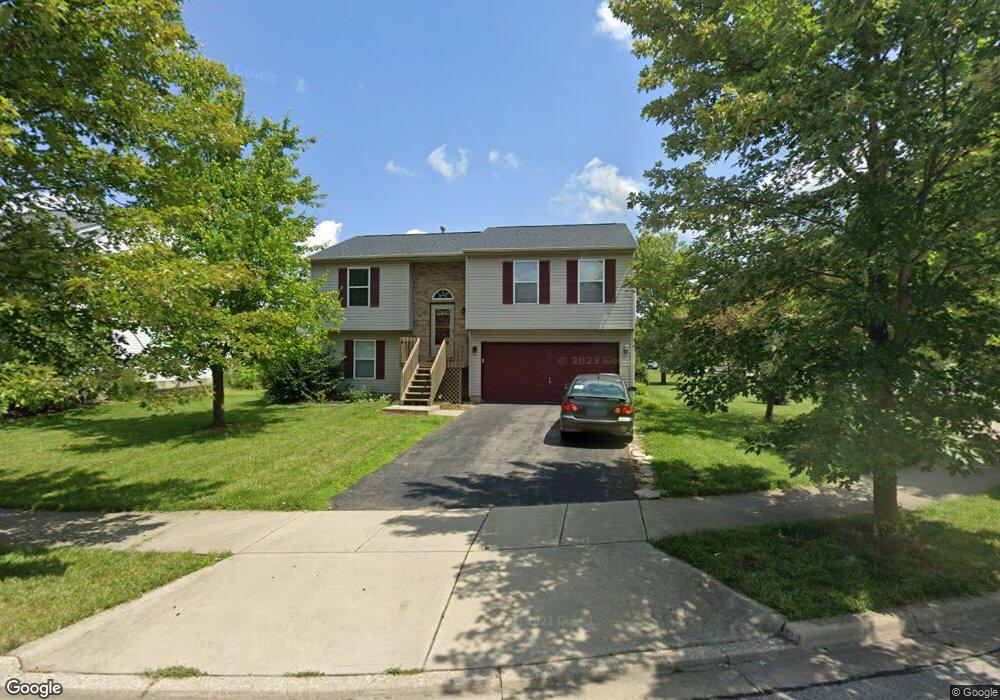
155 Harvard Loop Delaware, OH 43015
Estimated Value: $328,648 - $342,000
3
Beds
3
Baths
1,564
Sq Ft
$214/Sq Ft
Est. Value
About This Home
This home is located at 155 Harvard Loop, Delaware, OH 43015 and is currently estimated at $335,412, approximately $214 per square foot. 155 Harvard Loop is a home located in Delaware County with nearby schools including James Conger Elementary School, John C. Dempsey Middle School, and Rutherford B. Hayes High School.
Ownership History
Date
Name
Owned For
Owner Type
Purchase Details
Closed on
Apr 21, 2021
Bought by
Gwendoline E Lynch
Current Estimated Value
Home Financials for this Owner
Home Financials are based on the most recent Mortgage that was taken out on this home.
Interest Rate
3.04%
Purchase Details
Closed on
Apr 2, 2021
Sold by
Pitstick Donovan O and Pitstick Vicki K
Bought by
Lynch Gwendoline E
Home Financials for this Owner
Home Financials are based on the most recent Mortgage that was taken out on this home.
Interest Rate
3.04%
Purchase Details
Closed on
Apr 25, 2003
Sold by
Crossmann Communities Of Ohio Inc
Bought by
Pitstick Donovan O and Pitstick Vicki K
Home Financials for this Owner
Home Financials are based on the most recent Mortgage that was taken out on this home.
Original Mortgage
$147,534
Interest Rate
5.96%
Mortgage Type
FHA
Create a Home Valuation Report for This Property
The Home Valuation Report is an in-depth analysis detailing your home's value as well as a comparison with similar homes in the area
Home Values in the Area
Average Home Value in this Area
Purchase History
| Date | Buyer | Sale Price | Title Company |
|---|---|---|---|
| Gwendoline E Lynch | $247,050 | -- | |
| Lynch Gwendoline E | $247,120 | Stewart Title Box | |
| Pitstick Donovan O | $148,700 | Stewart Title Agency Of Colu |
Source: Public Records
Mortgage History
| Date | Status | Borrower | Loan Amount |
|---|---|---|---|
| Closed | Gwendoline E Lynch | -- | |
| Previous Owner | Pitstick Donovan O | $147,534 |
Source: Public Records
Tax History
| Year | Tax Paid | Tax Assessment Tax Assessment Total Assessment is a certain percentage of the fair market value that is determined by local assessors to be the total taxable value of land and additions on the property. | Land | Improvement |
|---|---|---|---|---|
| 2024 | $3,963 | $83,940 | $19,780 | $64,160 |
| 2023 | $3,970 | $83,940 | $19,780 | $64,160 |
| 2022 | $3,380 | $62,020 | $14,700 | $47,320 |
| 2021 | $3,455 | $62,020 | $14,700 | $47,320 |
| 2020 | $3,494 | $62,020 | $14,700 | $47,320 |
| 2019 | $3,214 | $51,700 | $12,250 | $39,450 |
| 2018 | $3,259 | $51,700 | $12,250 | $39,450 |
| 2017 | $2,963 | $46,660 | $10,290 | $36,370 |
| 2016 | $2,684 | $46,660 | $10,290 | $36,370 |
| 2015 | $2,699 | $46,660 | $10,290 | $36,370 |
| 2014 | $2,742 | $46,660 | $10,290 | $36,370 |
| 2013 | $2,757 | $46,660 | $10,290 | $36,370 |
Source: Public Records
Map
Nearby Homes
- 1767 Ashburn Dr
- 173 Old Colony Dr
- 1998 State Route 37 E
- 126 Wilder St
- 0 Fair Ave
- 381 Rochdale Run
- 98 Wilder St
- 447 Rochdale Run
- 60 Oak St
- 529 Rochdale Run
- 35 Chamberlain St
- 210 E Central Ave
- 87 Wellesley Dr
- 69 Wellesley Dr
- 102 Potter St
- 323 Via Condotti Viaduct
- 0 Dildine Rd Unit 225015764
- 278 Rochdale Run
- 111 Wellesley Dr
- 117 Wellesley Dr
- 137 Harvard Loop
- 131 Harvard Loop
- 201 Harvard Loop
- 154 Harvard Loop
- 166 Harvard Loop
- 207 Harvard Loop
- 142 Harvard Loop
- 160 Harvard Loop
- 136 Harvard Loop
- 172 Harvard Loop
- 148 Harvard Loop
- 125 Harvard Loop
- 130 Harvard Loop
- 215 Harvard Loop
- 178 Harvard Loop
- 124 Harvard Loop
- 1869 Ashburn Dr
- 196 Harvard Loop
- 1875 Ashburn Dr
- 202 Harvard Loop
Your Personal Tour Guide
Ask me questions while you tour the home.