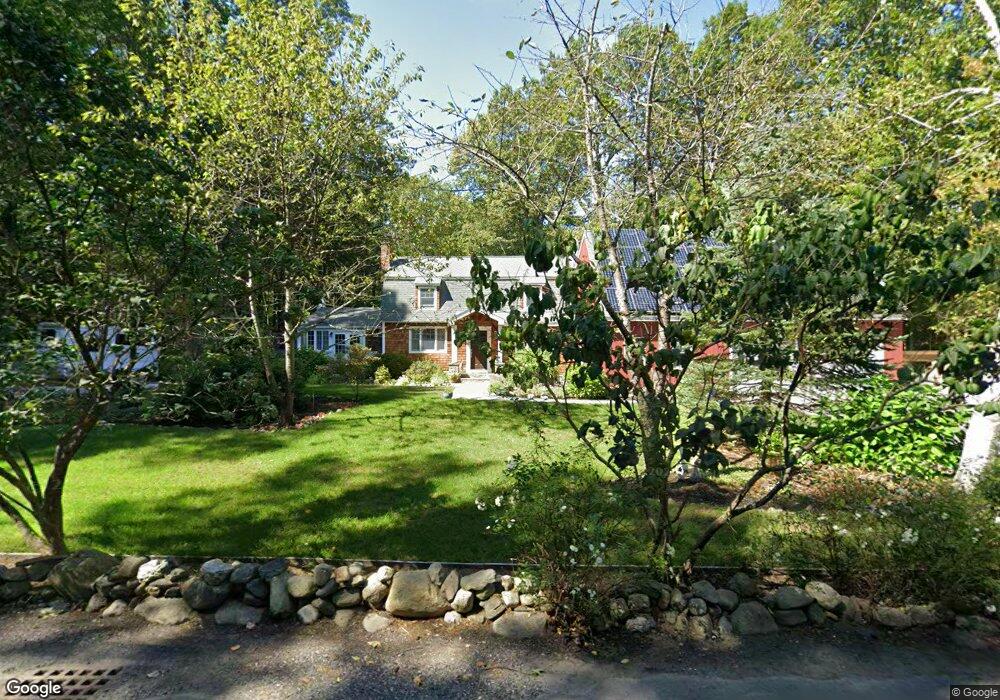
155 Heald St Pepperell, MA 01463
Estimated Value: $614,559 - $638,000
2
Beds
1
Bath
1,964
Sq Ft
$321/Sq Ft
Est. Value
About This Home
This home is located at 155 Heald St, Pepperell, MA 01463 and is currently estimated at $629,640, approximately $320 per square foot. 155 Heald St is a home located in Middlesex County with nearby schools including North Middlesex Regional High School and Pepperell Christian Academy.
Ownership History
Date
Name
Owned For
Owner Type
Purchase Details
Closed on
Jun 27, 1997
Sold by
Pare Deborah A and Pare Eugene A
Bought by
Menice Scott R and Menice Constance B
Current Estimated Value
Home Financials for this Owner
Home Financials are based on the most recent Mortgage that was taken out on this home.
Original Mortgage
$133,200
Interest Rate
7.81%
Mortgage Type
Purchase Money Mortgage
Create a Home Valuation Report for This Property
The Home Valuation Report is an in-depth analysis detailing your home's value as well as a comparison with similar homes in the area
Home Values in the Area
Average Home Value in this Area
Purchase History
| Date | Buyer | Sale Price | Title Company |
|---|---|---|---|
| Menice Scott R | $166,500 | -- |
Source: Public Records
Mortgage History
| Date | Status | Borrower | Loan Amount |
|---|---|---|---|
| Open | Menice Scott R | $133,450 | |
| Closed | Menice Scott R | $133,200 |
Source: Public Records
Tax History
| Year | Tax Paid | Tax Assessment Tax Assessment Total Assessment is a certain percentage of the fair market value that is determined by local assessors to be the total taxable value of land and additions on the property. | Land | Improvement |
|---|---|---|---|---|
| 2025 | $7,730 | $528,400 | $168,100 | $360,300 |
| 2024 | $7,073 | $492,900 | $152,100 | $340,800 |
| 2023 | $6,805 | $449,500 | $128,100 | $321,400 |
| 2022 | $7,080 | $412,800 | $128,100 | $284,700 |
| 2021 | $6,858 | $382,700 | $112,100 | $270,600 |
| 2020 | $8,808 | $386,200 | $112,100 | $274,100 |
| 2019 | $5,966 | $359,600 | $112,100 | $247,500 |
| 2018 | $5,691 | $347,200 | $112,100 | $235,100 |
| 2017 | $5,352 | $336,800 | $112,100 | $224,700 |
| 2016 | $4,633 | $280,300 | $112,100 | $168,200 |
| 2015 | $4,471 | $280,300 | $112,100 | $168,200 |
| 2014 | $4,395 | $277,100 | $112,100 | $165,000 |
Source: Public Records
Map
Nearby Homes
- 143 Heald St
- 2 Blueberry Hill Rd
- 2 Everett Dr
- 18 Maple St Unit 14
- 4 Wilderness Way
- 120 Townsend St Unit 1
- 120 Townsend St Unit 2
- 90 Townsend St
- 96 Townsend St
- 165 Townsend St
- 39 Mount Lebanon St
- 6 High Oaks Path
- 8 South St
- 4 Townsend St
- 226 Cherry Tree Ln
- 10 Cheyenne Rd
- 15 Squannacook Dr
- 198 N End Rd
- 21 Magnolia Ln
- 11 Maplewood Dr
Your Personal Tour Guide
Ask me questions while you tour the home.