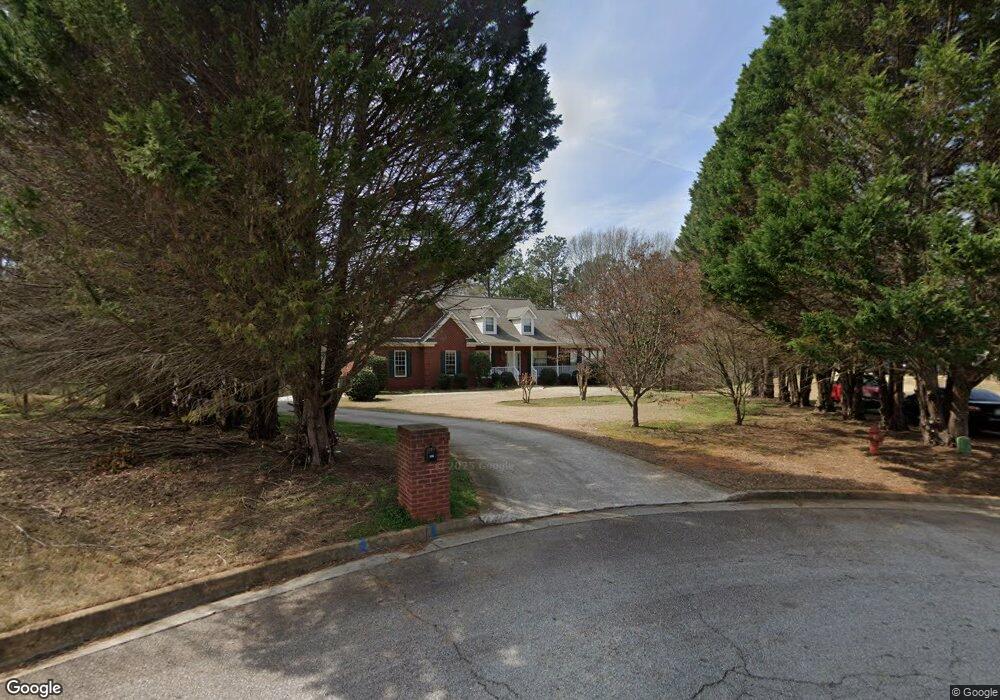
155 Highland Park Dr McDonough, GA 30252
Estimated Value: $447,412 - $565,000
2
Beds
4
Baths
2,989
Sq Ft
$167/Sq Ft
Est. Value
About This Home
This home is located at 155 Highland Park Dr, McDonough, GA 30252 and is currently estimated at $499,853, approximately $167 per square foot. 155 Highland Park Dr is a home located in Henry County with nearby schools including Tussahaw Elementary School, McDonough Middle School, and New Creation Christian Academy.
Ownership History
Date
Name
Owned For
Owner Type
Purchase Details
Closed on
Jul 2, 2015
Sold by
Biffle Christie
Bought by
Biffle Ronald K and Biffle Christie M
Current Estimated Value
Home Financials for this Owner
Home Financials are based on the most recent Mortgage that was taken out on this home.
Original Mortgage
$105,000
Outstanding Balance
$81,816
Interest Rate
3.92%
Mortgage Type
New Conventional
Estimated Equity
$418,037
Purchase Details
Closed on
Feb 25, 2015
Sold by
St John Joan Marie
Bought by
Biffle Christie
Purchase Details
Closed on
Nov 24, 1999
Sold by
Jackson Carla
Bought by
D & N Classic Hommes Inc
Home Financials for this Owner
Home Financials are based on the most recent Mortgage that was taken out on this home.
Original Mortgage
$35,000
Interest Rate
7.89%
Mortgage Type
New Conventional
Create a Home Valuation Report for This Property
The Home Valuation Report is an in-depth analysis detailing your home's value as well as a comparison with similar homes in the area
Home Values in the Area
Average Home Value in this Area
Purchase History
| Date | Buyer | Sale Price | Title Company |
|---|---|---|---|
| Biffle Ronald K | -- | -- | |
| Biffle Christie | -- | -- | |
| D & N Classic Hommes Inc | $35,000 | -- |
Source: Public Records
Mortgage History
| Date | Status | Borrower | Loan Amount |
|---|---|---|---|
| Open | Biffle Ronald K | $105,000 | |
| Previous Owner | D & N Classic Hommes Inc | $35,000 |
Source: Public Records
Tax History Compared to Growth
Tax History
| Year | Tax Paid | Tax Assessment Tax Assessment Total Assessment is a certain percentage of the fair market value that is determined by local assessors to be the total taxable value of land and additions on the property. | Land | Improvement |
|---|---|---|---|---|
| 2025 | $5,705 | $206,600 | $24,000 | $182,600 |
| 2024 | $5,705 | $198,560 | $24,000 | $174,560 |
| 2023 | $5,508 | $208,800 | $18,000 | $190,800 |
| 2022 | $4,908 | $162,160 | $18,000 | $144,160 |
| 2021 | $4,534 | $146,680 | $18,000 | $128,680 |
| 2020 | $4,282 | $136,120 | $17,000 | $119,120 |
| 2019 | $4,183 | $140,400 | $17,000 | $123,400 |
| 2018 | $4,183 | $133,880 | $17,000 | $116,880 |
| 2016 | $3,220 | $93,560 | $10,000 | $83,560 |
| 2015 | $1,129 | $83,600 | $8,000 | $75,600 |
| 2014 | -- | $80,280 | $8,000 | $72,280 |
Source: Public Records
Map
Nearby Homes
- 312 Amble Side
- 292 Aylesbury Blvd
- 300 Madison Grace Ave
- 297 Aylesbury Blvd
- 289 Aylesbury Blvd
- 189 Delilah St
- 205 Delilah St
- 466 Best Friends Turn Alley
- 645 Vidalia Pkwy
- 536 Elkwood Ln
- 633 Vidalia Park Way
- The Katelyn Plan at Symphony Park - Townside at Symphony
- The Sweetwater Exterior Plan at Symphony Park - Townside at Symphony
- The Azalea Interior Plan at Symphony Park - Townside at Symphony
- The Lily Interior Plan at Symphony Park - Townside at Symphony
- The Rose Exterior Plan at Symphony Park - Townside at Symphony
- The Sweetwater Interior Plan at Symphony Park - Townside at Symphony
- The Daisy Exterior Plan at Symphony Park - Townside at Symphony
- 217 Kindness Cir
- 229 Kindness Cir
- 160 Highland Park Dr
- 149 Highland Park Dr
- 732 Madison Grace Ave
- 148 Highland Park Dr
- 143 Highland Park Dr
- 154 Highland Park Dr
- 142 Highland Park Dr
- 909 Bronte Way Unit 40
- 904 Bronte Way Unit 39
- 905 Bronte Way Unit 41
- 137 Highland Park Dr
- 136 Highland Park Dr
- 131 Highland Park Dr
- 200 Madison Grace Ave Unit 57
- 200 Madison Grace Ave
- 208 Madison Grace Ave
- 212 Madison Grace Ave
- 204 Madison Grace Ave
- 130 Highland Park Dr
- 216 Madison Grace Ave