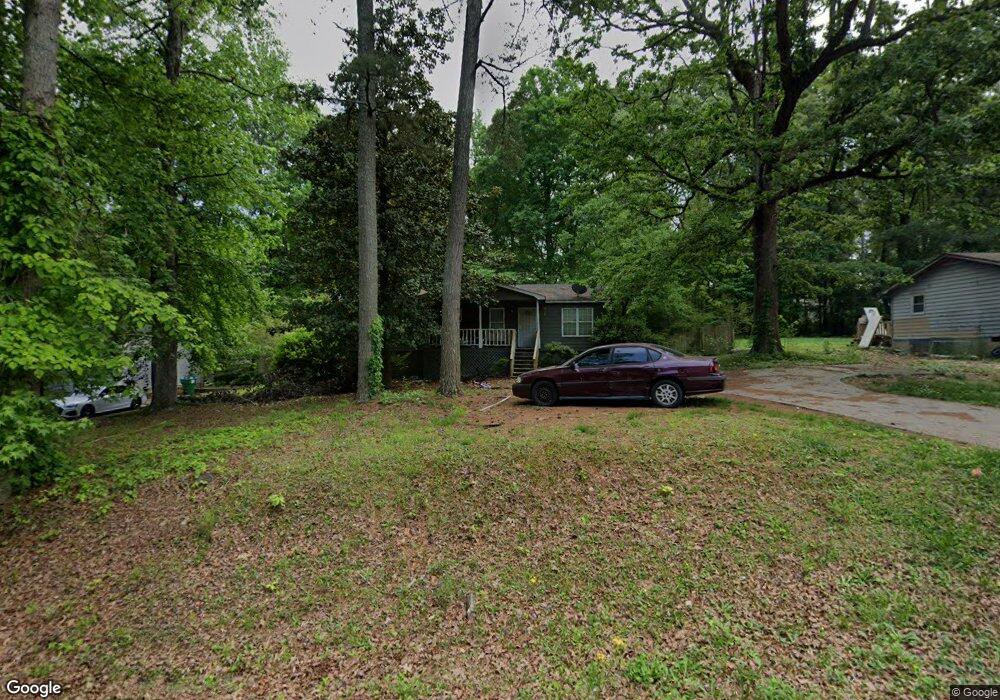
155 Knob Dr Carrollton, GA 30116
Estimated Value: $193,559 - $234,000
3
Beds
2
Baths
1,200
Sq Ft
$177/Sq Ft
Est. Value
About This Home
This home is located at 155 Knob Dr, Carrollton, GA 30116 and is currently estimated at $212,390, approximately $176 per square foot. 155 Knob Dr is a home located in Carroll County with nearby schools including Central Elementary School, Central Middle School, and Central High School.
Ownership History
Date
Name
Owned For
Owner Type
Purchase Details
Closed on
Dec 9, 2010
Sold by
Federal National Mortgage Association
Bought by
Collins Alicia D
Current Estimated Value
Purchase Details
Closed on
Oct 5, 2010
Sold by
Bank Of America Na
Bought by
Federal National Mortgage Association
Purchase Details
Closed on
Jun 21, 2007
Sold by
Dunson Antwana L
Bought by
Griffin Sheena
Home Financials for this Owner
Home Financials are based on the most recent Mortgage that was taken out on this home.
Original Mortgage
$96,000
Interest Rate
6.35%
Mortgage Type
New Conventional
Purchase Details
Closed on
Apr 16, 2007
Sold by
Citimtg Inc
Bought by
Dunson Antwana L
Purchase Details
Closed on
Dec 5, 2006
Sold by
Not Provided
Bought by
Collins Alicia D
Purchase Details
Closed on
Jul 10, 1991
Bought by
Anderson Michael
Create a Home Valuation Report for This Property
The Home Valuation Report is an in-depth analysis detailing your home's value as well as a comparison with similar homes in the area
Home Values in the Area
Average Home Value in this Area
Purchase History
| Date | Buyer | Sale Price | Title Company |
|---|---|---|---|
| Collins Alicia D | -- | -- | |
| Federal National Mortgage Association | $87,500 | -- | |
| Griffin Sheena | $96,000 | -- | |
| Dunson Antwana L | $54,000 | -- | |
| Collins Alicia D | $29,900 | -- | |
| Anderson Michael | $53,500 | -- |
Source: Public Records
Mortgage History
| Date | Status | Borrower | Loan Amount |
|---|---|---|---|
| Previous Owner | Griffin Sheena | $96,000 |
Source: Public Records
Tax History Compared to Growth
Tax History
| Year | Tax Paid | Tax Assessment Tax Assessment Total Assessment is a certain percentage of the fair market value that is determined by local assessors to be the total taxable value of land and additions on the property. | Land | Improvement |
|---|---|---|---|---|
| 2024 | $1,260 | $55,690 | $5,000 | $50,690 |
| 2023 | $1,260 | $51,135 | $5,000 | $46,135 |
| 2022 | $1,054 | $42,025 | $5,000 | $37,025 |
| 2021 | $945 | $36,852 | $5,000 | $31,852 |
| 2020 | $859 | $33,448 | $5,000 | $28,448 |
| 2019 | $785 | $30,346 | $4,000 | $26,346 |
| 2018 | $585 | $22,273 | $4,000 | $18,273 |
| 2017 | $419 | $22,273 | $4,000 | $18,273 |
| 2016 | $419 | $22,273 | $4,000 | $18,273 |
| 2015 | $303 | $14,843 | $4,000 | $10,844 |
| 2014 | $305 | $14,844 | $4,000 | $10,844 |
Source: Public Records
Map
Nearby Homes
- 690 Horsley Mill Rd
- 680 Horsley Mill Rd
- 240 Knob Dr
- 5 Knob Dr
- 103 Hilo Ct
- TRACT 8 Horsley Mill Rd
- TRACT 9 Horsley Mill Rd
- The Rosewood Plan at Oak Mountain View
- The Northview Plan at Oak Mountain View
- The Newburgh Plan at Oak Mountain View
- The Brookdale Plan at Oak Mountain View
- The Donovan Plan at Oak Mountain View
- The Rochester Plan at Oak Mountain View
- The Wendell Plan at Oak Mountain View
- The Carrollton Plan at Oak Mountain View
- 971 Horsley Mill Rd
- 204 Pinehurst Way
- 205 Turnberry Cir
- 116 Camilla Dr
- 214 Asher Dr