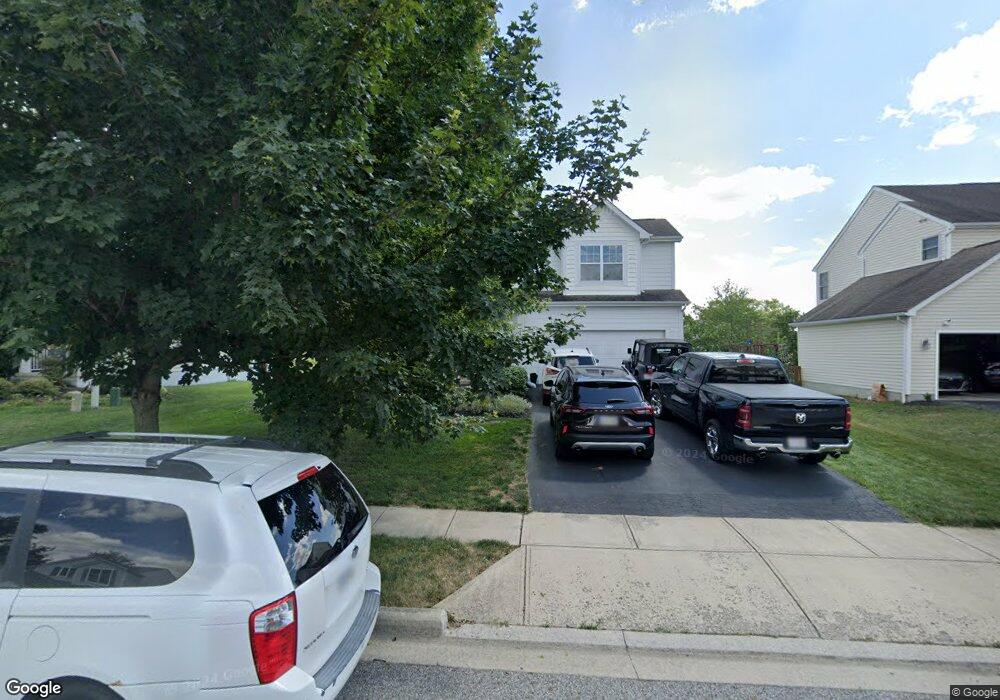
155 Longleaf St Unit 246 Pickerington, OH 43147
Estimated Value: $402,951 - $470,000
3
Beds
3
Baths
1,649
Sq Ft
$267/Sq Ft
Est. Value
About This Home
This home is located at 155 Longleaf St Unit 246, Pickerington, OH 43147 and is currently estimated at $439,488, approximately $266 per square foot. 155 Longleaf St Unit 246 is a home located in Fairfield County with nearby schools including Sycamore Creek Elementary School, Diley Middle School, and Pickerington Ridgeview Junior High School.
Ownership History
Date
Name
Owned For
Owner Type
Purchase Details
Closed on
May 8, 2018
Sold by
Kevin F Dolan
Bought by
Young Meredith
Current Estimated Value
Home Financials for this Owner
Home Financials are based on the most recent Mortgage that was taken out on this home.
Original Mortgage
$225,735
Outstanding Balance
$192,962
Interest Rate
4.55%
Estimated Equity
$246,526
Purchase Details
Closed on
May 3, 2018
Sold by
Flowers Stephanie A
Bought by
Young Meredith Kathleen
Home Financials for this Owner
Home Financials are based on the most recent Mortgage that was taken out on this home.
Original Mortgage
$225,735
Outstanding Balance
$192,962
Interest Rate
4.55%
Estimated Equity
$246,526
Purchase Details
Closed on
Aug 27, 2010
Sold by
M/I Homes Of Central Ohio Llc
Bought by
Flowers Stephanie A
Home Financials for this Owner
Home Financials are based on the most recent Mortgage that was taken out on this home.
Original Mortgage
$167,395
Interest Rate
4.4%
Mortgage Type
FHA
Create a Home Valuation Report for This Property
The Home Valuation Report is an in-depth analysis detailing your home's value as well as a comparison with similar homes in the area
Home Values in the Area
Average Home Value in this Area
Purchase History
| Date | Buyer | Sale Price | Title Company |
|---|---|---|---|
| Young Meredith | -- | -- | |
| Young Meredith Kathleen | $229,900 | -- | |
| Flowers Stephanie A | $169,700 | None Available |
Source: Public Records
Mortgage History
| Date | Status | Borrower | Loan Amount |
|---|---|---|---|
| Open | Young Meredith Kathleen | $225,735 | |
| Closed | Young Meredith Kathleen | -- | |
| Closed | Young Meredith Kathleen | -- | |
| Previous Owner | Flowers Stephanie A | $167,395 |
Source: Public Records
Tax History
| Year | Tax Paid | Tax Assessment Tax Assessment Total Assessment is a certain percentage of the fair market value that is determined by local assessors to be the total taxable value of land and additions on the property. | Land | Improvement |
|---|---|---|---|---|
| 2025 | $12,885 | $124,160 | $33,440 | $90,720 |
| 2024 | $12,885 | $104,670 | $14,860 | $89,810 |
| 2023 | $4,935 | $104,670 | $14,860 | $89,810 |
| 2022 | $4,951 | $104,670 | $14,860 | $89,810 |
| 2021 | $4,274 | $76,960 | $14,150 | $62,810 |
| 2020 | $4,321 | $76,960 | $14,150 | $62,810 |
| 2019 | $4,348 | $76,960 | $14,150 | $62,810 |
| 2018 | $4,409 | $67,900 | $14,150 | $53,750 |
| 2017 | $4,422 | $66,410 | $12,660 | $53,750 |
| 2016 | $4,402 | $66,410 | $12,660 | $53,750 |
| 2015 | $4,200 | $59,920 | $10,550 | $49,370 |
| 2014 | $4,152 | $59,920 | $10,550 | $49,370 |
| 2013 | $4,152 | $59,920 | $10,550 | $49,370 |
Source: Public Records
Map
Nearby Homes
- 9670 Schoolhouse Rd NW
- 143 Cinnamon Teal St
- 216 Painter St
- 139 Gold Finch St
- 108 Gold Finch St
- 116 Gold Finch St
- 217 Warbler Ct
- 566 Preston Trails Dr
- 223 Antrim St
- 10164 Busey Rd NW
- 657 Norfolk Square S
- 657 Raab St
- 5436 Arrow Ct
- 240 Fox Glen Dr E
- 7523 Canal Highlands Blvd
- 7516 Hemrich Dr
- 7502 Canal Highlands Blvd
- 7474 Canal Highlands Blvd
- 160 Lorrimore Dr
- 163 Lorrimore Dr
- 155 Longleaf St
- 151 Longleaf St
- 151 Longleaf St Unit 245
- 159 Longleaf St
- 163 Longleaf St
- 178 Longleaf St
- 178 Longleaf St Unit 194
- 206 Durand Ct
- 182 Longleaf St
- 182 Longleaf St Unit 193
- 202 Durand Ct
- 167 Longleaf St
- 170 Longleaf St
- 170 Longleaf St Unit 196
- 210 Durand St
- 186 Longleaf St
- 166 Longleaf St
- 214 Durand St
- 190 Longleaf St
- 190 Longleaf St Unit 191
Your Personal Tour Guide
Ask me questions while you tour the home.