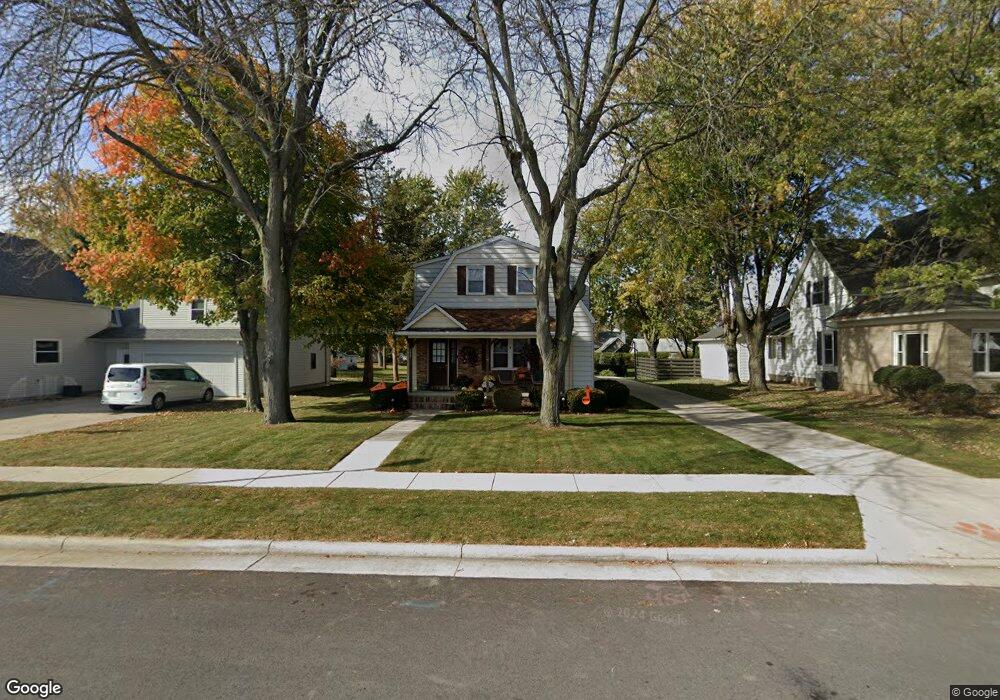
155 N Hanover St Minster, OH 45865
Estimated Value: $254,000 - $337,000
4
Beds
2
Baths
2,492
Sq Ft
$118/Sq Ft
Est. Value
About This Home
This home is located at 155 N Hanover St, Minster, OH 45865 and is currently estimated at $294,980, approximately $118 per square foot. 155 N Hanover St is a home located in Auglaize County with nearby schools including Minster Elementary School and Minster Junior/Senior High School.
Ownership History
Date
Name
Owned For
Owner Type
Purchase Details
Closed on
Jun 30, 2023
Sold by
Niemeyer Bryan A and Niemeyer Tonya F
Bought by
Trego Joseph and Trego Lisa
Current Estimated Value
Home Financials for this Owner
Home Financials are based on the most recent Mortgage that was taken out on this home.
Original Mortgage
$152,928
Outstanding Balance
$148,670
Interest Rate
6.79%
Mortgage Type
FHA
Estimated Equity
$146,310
Purchase Details
Closed on
Apr 28, 2014
Sold by
Niemeyer Bryan A and Niemeyer Tonya F
Bought by
Trego Joe and Trego Lisa
Purchase Details
Closed on
Nov 25, 2008
Sold by
Niemeyer Bryan A and Niemeyer Tonya F
Bought by
Farno John W and Farno Angela
Home Financials for this Owner
Home Financials are based on the most recent Mortgage that was taken out on this home.
Original Mortgage
$154,900
Interest Rate
6.48%
Mortgage Type
Seller Take Back
Purchase Details
Closed on
Jul 9, 2001
Sold by
Trzaska Steven A
Bought by
Niemeyer Bryan A
Purchase Details
Closed on
Dec 24, 1996
Sold by
Bey Roger L
Bought by
Trzaska Steven A
Create a Home Valuation Report for This Property
The Home Valuation Report is an in-depth analysis detailing your home's value as well as a comparison with similar homes in the area
Home Values in the Area
Average Home Value in this Area
Purchase History
| Date | Buyer | Sale Price | Title Company |
|---|---|---|---|
| Trego Joseph | $155,666 | None Listed On Document | |
| Trego Joe | $171,900 | None Available | |
| Farno John W | $169,900 | Attorney | |
| Niemeyer Bryan A | $144,800 | -- | |
| Trzaska Steven A | $116,000 | -- |
Source: Public Records
Mortgage History
| Date | Status | Borrower | Loan Amount |
|---|---|---|---|
| Open | Trego Joseph | $152,928 | |
| Previous Owner | Farno John W | $154,900 | |
| Closed | Trego Joe | $0 |
Source: Public Records
Tax History
| Year | Tax Paid | Tax Assessment Tax Assessment Total Assessment is a certain percentage of the fair market value that is determined by local assessors to be the total taxable value of land and additions on the property. | Land | Improvement |
|---|---|---|---|---|
| 2025 | $6,060 | $87,230 | $15,740 | $71,490 |
| 2024 | $6,060 | $87,230 | $15,740 | $71,490 |
| 2023 | $2,953 | $87,230 | $15,740 | $71,490 |
| 2022 | $2,670 | $73,280 | $14,440 | $58,840 |
| 2021 | $2,728 | $73,280 | $14,440 | $58,840 |
| 2020 | $1,403 | $73,280 | $14,445 | $58,835 |
| 2019 | $2,793 | $60,214 | $11,872 | $48,342 |
| 2018 | $2,806 | $60,214 | $11,872 | $48,342 |
| 2017 | $2,628 | $60,214 | $11,872 | $48,342 |
| 2016 | $2,396 | $52,459 | $10,770 | $41,689 |
| 2015 | $2,375 | $52,459 | $10,770 | $41,689 |
| 2014 | $2,410 | $52,459 | $10,770 | $41,689 |
| 2013 | $2,502 | $52,459 | $10,770 | $41,689 |
Source: Public Records
Map
Nearby Homes
- 7 E 2nd St
- 17 Stonegate Dr
- 0 Stonegate Dr Unit 14 10544847
- 0 Stonegate Dr Unit 21 10544857
- 36 Shania Place Unit 23
- 28 Shania Place Unit 33
- 19 Shania Place Unit 33
- 27 Shania Place Unit 26
- 561 S Walnut St Unit Lot3
- 610 S Walnut St
- 1991 Minster Egypt Pike
- 5761 Fisher & Koverman Rd
- 217 S Washington St
- 410 E Cherry St
- 312 Margaret St
- 316 Margaret St
- 323 Margaret St
- 130 Janice Dr
- 424 E Plum St
- 420 E Plum St
- 163 N Hanover St
- 147 N Hanover St
- 139 N Hanover St
- 171 N Hanover St
- 131 N Hanover St
- 179 N Hanover St
- 156 N Frankfort St
- 7 Melcher St
- 164 N Frankfort St
- 140 N Frankfort St
- 187 N Hanover St
- 19 Melcher St
- 132 N Frankfort St
- 172 N Frankfort St
- 115 N Hanover St
- 115 N Hanover St
- 45 W 6th St
- 39 W 6th St
- 195 N Hanover St
- 180 N Frankfort St
Your Personal Tour Guide
Ask me questions while you tour the home.