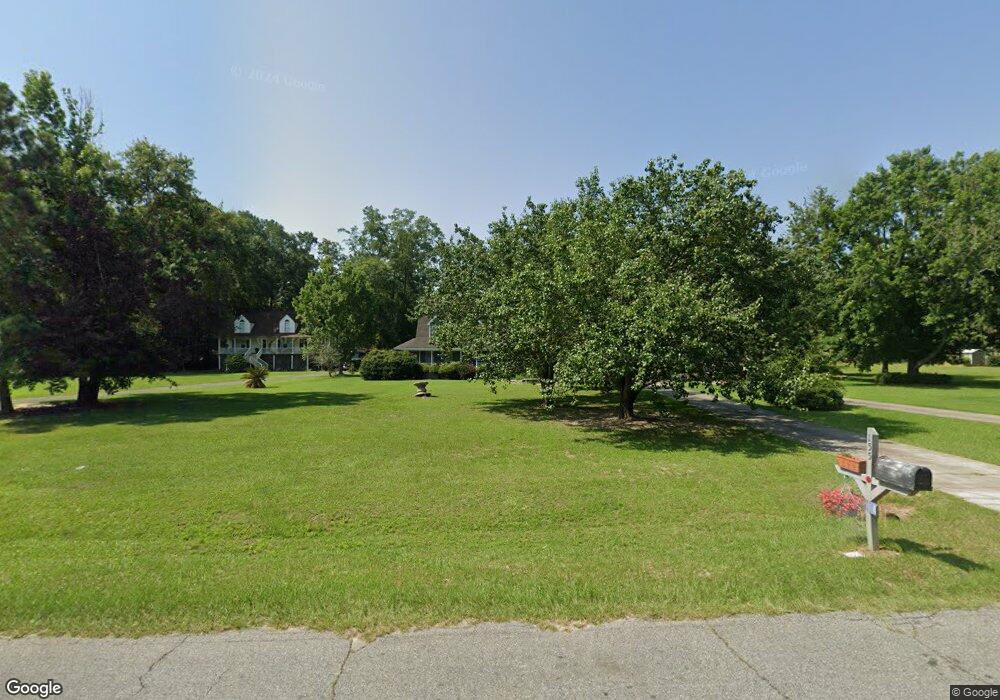
155 N Valhalla Dr Cordele, GA 31015
Estimated Value: $637,000 - $719,000
3
Beds
3
Baths
2,587
Sq Ft
$259/Sq Ft
Est. Value
About This Home
This home is located at 155 N Valhalla Dr, Cordele, GA 31015 and is currently estimated at $670,022, approximately $258 per square foot. 155 N Valhalla Dr is a home located in Crisp County with nearby schools including Crisp County Elementary School, Crisp County Primary School, and Crisp County Middle School.
Ownership History
Date
Name
Owned For
Owner Type
Purchase Details
Closed on
Sep 4, 2020
Sold by
Macy Mary A
Bought by
Wagner Gia M
Current Estimated Value
Home Financials for this Owner
Home Financials are based on the most recent Mortgage that was taken out on this home.
Original Mortgage
$191,000
Outstanding Balance
$130,358
Interest Rate
2.8%
Mortgage Type
New Conventional
Estimated Equity
$539,664
Purchase Details
Closed on
May 26, 2016
Sold by
Moseley Carl T
Bought by
Macy Mary A and Parsons Jeffrey T
Home Financials for this Owner
Home Financials are based on the most recent Mortgage that was taken out on this home.
Original Mortgage
$160,000
Interest Rate
2.89%
Mortgage Type
New Conventional
Purchase Details
Closed on
Sep 8, 1999
Sold by
Yawn James R and Yawn Mela
Bought by
Moseley Carl T
Purchase Details
Closed on
Feb 3, 1992
Bought by
Yawn James R and Yawn Mela
Create a Home Valuation Report for This Property
The Home Valuation Report is an in-depth analysis detailing your home's value as well as a comparison with similar homes in the area
Home Values in the Area
Average Home Value in this Area
Purchase History
| Date | Buyer | Sale Price | Title Company |
|---|---|---|---|
| Wagner Gia M | $335,085 | -- | |
| Macy Mary A | $200,000 | -- | |
| Moseley Carl T | $190,000 | -- | |
| Yawn James R | $15,000 | -- |
Source: Public Records
Mortgage History
| Date | Status | Borrower | Loan Amount |
|---|---|---|---|
| Open | Wagner Gia M | $191,000 | |
| Previous Owner | Macy Mary A | $160,000 |
Source: Public Records
Tax History Compared to Growth
Tax History
| Year | Tax Paid | Tax Assessment Tax Assessment Total Assessment is a certain percentage of the fair market value that is determined by local assessors to be the total taxable value of land and additions on the property. | Land | Improvement |
|---|---|---|---|---|
| 2025 | $6,244 | $244,056 | $75,426 | $168,630 |
| 2024 | $6,244 | $230,627 | $75,426 | $155,201 |
| 2023 | $5,601 | $199,436 | $75,426 | $124,010 |
| 2022 | $3,961 | $141,046 | $22,184 | $118,862 |
| 2021 | $3,689 | $124,393 | $22,184 | $102,209 |
| 2020 | $3,354 | $114,928 | $26,528 | $88,400 |
| 2019 | $3,332 | $114,928 | $26,528 | $88,400 |
| 2018 | $3,154 | $102,999 | $28,731 | $74,268 |
| 2017 | $2,728 | $88,708 | $28,731 | $59,977 |
| 2016 | $2,663 | $88,708 | $28,731 | $59,977 |
| 2015 | -- | $88,708 | $28,731 | $59,977 |
| 2014 | -- | $88,708 | $28,731 | $59,977 |
| 2013 | -- | $88,708 | $28,730 | $59,977 |
Source: Public Records
Map
Nearby Homes
- 177 N Valhalla Dr
- 126 N Valhalla Dr
- 132 Valhalla Rd S
- 117 N Valhalla Ln
- 0 the Retreat at Valhalla N
- 114 N Valhalla Dr
- 0 Valhalla Rd S Unit 138510
- 241 Valhalla Rd S Unit LOT 1
- 241 Valhalla Rd S Unit LOT 4
- 241 Valhalla Rd S Unit LOT 2
- 241 Valhalla Rd S Unit LOT 3
- 120 Valhalla Rd
- 118 Valhalla Rd S
- 0 Cannon Branch Rd Unit 179188
- 0 Cannon Branch Rd Unit 10635232
- Lot # 18 Cannon Branch Rd
- Lot #35 Cannon Branch Rd
- Lot #32 Cannon Branch Rd
- Lot # 30 Cannon Branch Rd
- Lot # 17 Cannon Branch Rd
- 155 N Valhalla Dr
- 153 N Valhalla Dr
- 157 N Valhalla Dr
- LOT 73 N Valhalla Dr
- Lot#99 N Valhalla Dr
- 154 - 9 N Valhalla Dr
- 154 - 8 N Valhalla Dr
- 154 - 7 N Valhalla Dr
- Lot # 80 N Valhalla Dr
- 91 N Valhalla Dr
- 0 N Valhalla Dr
- 149 N Valhalla Dr
- 161 Valhalla
- 161 N Valhalla Dr
- 143 Valhalla
- 143 N Valhalla Cir
- 165 N Valhalla Dr
- 142 N Valhalla Ct
- 152 N Valhalla Ln
- 152 N Valhalla Ln