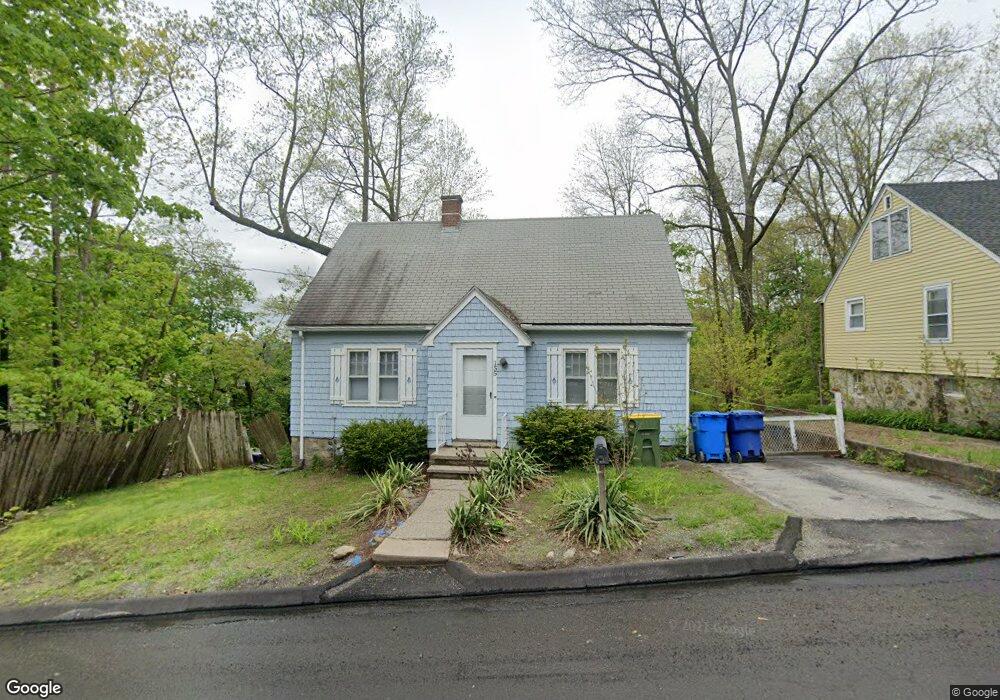
155 N Walnut St Waterbury, CT 06704
North End District NeighborhoodEstimated Value: $199,000 - $282,000
2
Beds
2
Baths
1,365
Sq Ft
$189/Sq Ft
Est. Value
About This Home
This home is located at 155 N Walnut St, Waterbury, CT 06704 and is currently estimated at $257,689, approximately $188 per square foot. 155 N Walnut St is a home located in New Haven County with nearby schools including Wilby High School and Alpha & Omega Christian Academy.
Ownership History
Date
Name
Owned For
Owner Type
Purchase Details
Closed on
Mar 22, 2013
Sold by
Lamar Kim S
Bought by
Lamar Dosia
Current Estimated Value
Purchase Details
Closed on
Apr 6, 2005
Sold by
Sparks Angela
Bought by
Lamar Dosia and Lamar Kim S
Home Financials for this Owner
Home Financials are based on the most recent Mortgage that was taken out on this home.
Original Mortgage
$78,400
Interest Rate
5.7%
Mortgage Type
Purchase Money Mortgage
Purchase Details
Closed on
May 1, 1995
Sold by
Recupero Mary
Bought by
Sparks Angela
Create a Home Valuation Report for This Property
The Home Valuation Report is an in-depth analysis detailing your home's value as well as a comparison with similar homes in the area
Home Values in the Area
Average Home Value in this Area
Purchase History
| Date | Buyer | Sale Price | Title Company |
|---|---|---|---|
| Lamar Dosia | -- | -- | |
| Lamar Dosia | $98,000 | -- | |
| Sparks Angela | $60,000 | -- |
Source: Public Records
Mortgage History
| Date | Status | Borrower | Loan Amount |
|---|---|---|---|
| Open | Sparks Angela | $61,939 | |
| Previous Owner | Sparks Angela | $78,400 | |
| Previous Owner | Sparks Angela | $19,600 |
Source: Public Records
Tax History Compared to Growth
Tax History
| Year | Tax Paid | Tax Assessment Tax Assessment Total Assessment is a certain percentage of the fair market value that is determined by local assessors to be the total taxable value of land and additions on the property. | Land | Improvement |
|---|---|---|---|---|
| 2025 | $3,530 | $78,470 | $12,320 | $66,150 |
| 2024 | $3,880 | $78,470 | $12,320 | $66,150 |
| 2023 | $4,252 | $78,470 | $12,320 | $66,150 |
| 2022 | $2,752 | $45,700 | $12,340 | $33,360 |
| 2021 | $2,752 | $45,700 | $12,340 | $33,360 |
| 2020 | $2,752 | $45,700 | $12,340 | $33,360 |
| 2019 | $2,752 | $45,700 | $12,340 | $33,360 |
| 2018 | $2,752 | $45,700 | $12,340 | $33,360 |
| 2017 | $3,100 | $51,490 | $12,350 | $39,140 |
| 2016 | $3,100 | $51,490 | $12,350 | $39,140 |
| 2015 | $2,998 | $51,490 | $12,350 | $39,140 |
| 2014 | $2,998 | $51,490 | $12,350 | $39,140 |
Source: Public Records
Map
Nearby Homes