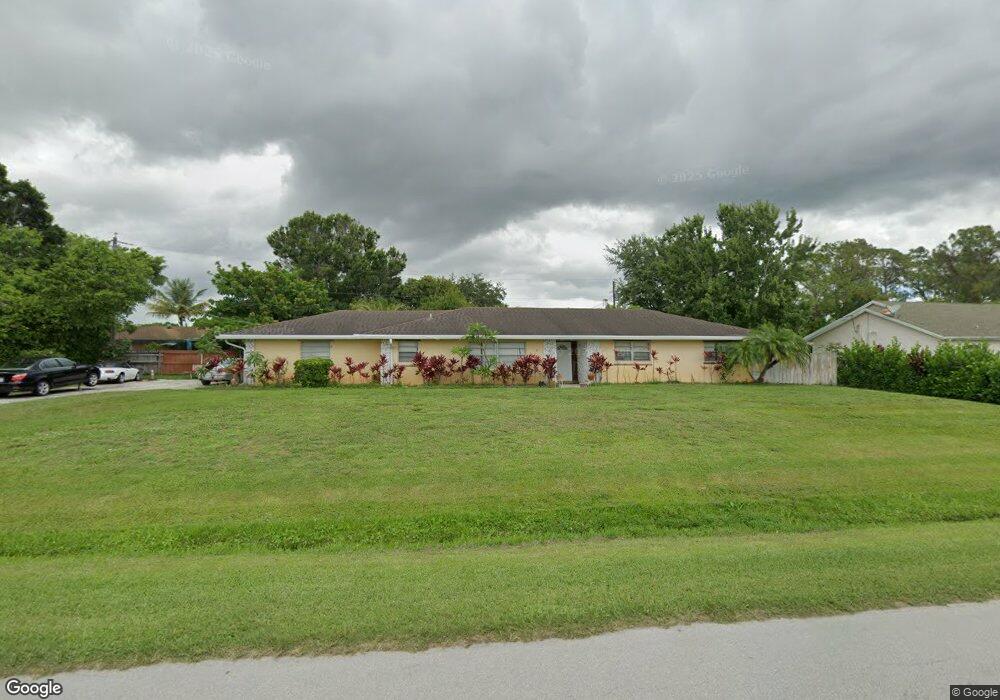
155 NE Twylite Terrace Port Saint Lucie, FL 34983
Northport Village NeighborhoodEstimated Value: $357,601 - $414,000
3
Beds
2
Baths
1,842
Sq Ft
$206/Sq Ft
Est. Value
About This Home
This home is located at 155 NE Twylite Terrace, Port Saint Lucie, FL 34983 and is currently estimated at $378,900, approximately $205 per square foot. 155 NE Twylite Terrace is a home located in St. Lucie County with nearby schools including Northport K-8 School, Parkway Elementary School, and Floresta Elementary School.
Ownership History
Date
Name
Owned For
Owner Type
Purchase Details
Closed on
Nov 5, 2009
Sold by
Rosbury William
Bought by
Smith Michael
Current Estimated Value
Purchase Details
Closed on
Dec 10, 2008
Sold by
Rosbury Amanda M
Bought by
Rosbury William R
Purchase Details
Closed on
Mar 22, 2000
Sold by
Amer Spirit Foundation Inc
Bought by
Rosbury William R and Rosbury Amanda M
Home Financials for this Owner
Home Financials are based on the most recent Mortgage that was taken out on this home.
Original Mortgage
$81,900
Interest Rate
8.37%
Purchase Details
Closed on
Mar 4, 2000
Sold by
Dept Housing & Urban Dev Wa D C
Bought by
Amer Spirit Foundation Inc
Home Financials for this Owner
Home Financials are based on the most recent Mortgage that was taken out on this home.
Original Mortgage
$81,900
Interest Rate
8.37%
Create a Home Valuation Report for This Property
The Home Valuation Report is an in-depth analysis detailing your home's value as well as a comparison with similar homes in the area
Home Values in the Area
Average Home Value in this Area
Purchase History
| Date | Buyer | Sale Price | Title Company |
|---|---|---|---|
| Smith Michael | $62,000 | Liberty Title Company Of Ame | |
| Rosbury William R | -- | Attorney | |
| Rosbury William R | $91,000 | -- | |
| Amer Spirit Foundation Inc | $73,000 | -- |
Source: Public Records
Mortgage History
| Date | Status | Borrower | Loan Amount |
|---|---|---|---|
| Previous Owner | Rosbury William R | $81,900 |
Source: Public Records
Tax History Compared to Growth
Tax History
| Year | Tax Paid | Tax Assessment Tax Assessment Total Assessment is a certain percentage of the fair market value that is determined by local assessors to be the total taxable value of land and additions on the property. | Land | Improvement |
|---|---|---|---|---|
| 2024 | $5,687 | $295,900 | $157,600 | $138,300 |
| 2023 | $5,687 | $297,000 | $148,600 | $148,400 |
| 2022 | $5,084 | $249,400 | $126,600 | $122,800 |
| 2021 | $4,473 | $183,400 | $69,600 | $113,800 |
| 2020 | $4,215 | $168,200 | $60,500 | $107,700 |
| 2019 | $3,971 | $157,100 | $45,700 | $111,400 |
| 2018 | $3,614 | $152,100 | $42,300 | $109,800 |
| 2017 | $3,346 | $131,500 | $38,300 | $93,200 |
| 2016 | $3,032 | $109,700 | $26,900 | $82,800 |
| 2015 | $2,774 | $89,900 | $17,400 | $72,500 |
| 2014 | $2,488 | $83,200 | $0 | $0 |
Source: Public Records
Map
Nearby Homes
- 738 NE Lanfair St
- 158 NE Twylite Terrace
- 757 NE Galilean St
- 258 NE Sagamore Terrace
- 208 NE Sagamore Terrace
- 256 NE Saint James Dr
- 138 NE Twylite Terrace
- 244 NE Saint James Dr
- 256 NE Saint James Dr
- 283 NE Sagamore Terrace
- 324 NE Gladiola Ave
- 198 NE St James Dr
- 315 NE Granduer Ave
- 281 NE Greenbrier Ave
- 382 NE Genesee Ave
- 390 NE Genesee Ave
- 109 NE Twylite Terrace
- 201 NW Goldcoast Ave
- 615 NE Canoe Park Cir
- 616 NE Canoe Park Cir
- 159 NE Twylite Terrace
- 717 NE Lanfair St
- 733 NE Lanfair St
- 151 NE Twylite Terrace
- 749 NE Lanfair St
- 156 NE Twylite Terrace
- 160 NE Twylite Terrace
- 154 NE Twylite Terrace
- 162 NE Twylite Terrace
- 765 NE Lanfair St
- 167 NE Twylite Terrace
- 726 NE Lanfair St
- 152 NE Twylite Terrace
- 702 NE Lanfair St Unit B
- 702 NE Lanfair St Unit A
- 702 NE Lanfair St
- 750 NE Lanfair St
- 150 NE Twylite Terrace
- 714 NE Lanfair St
- 166 NE Twylite Terrace