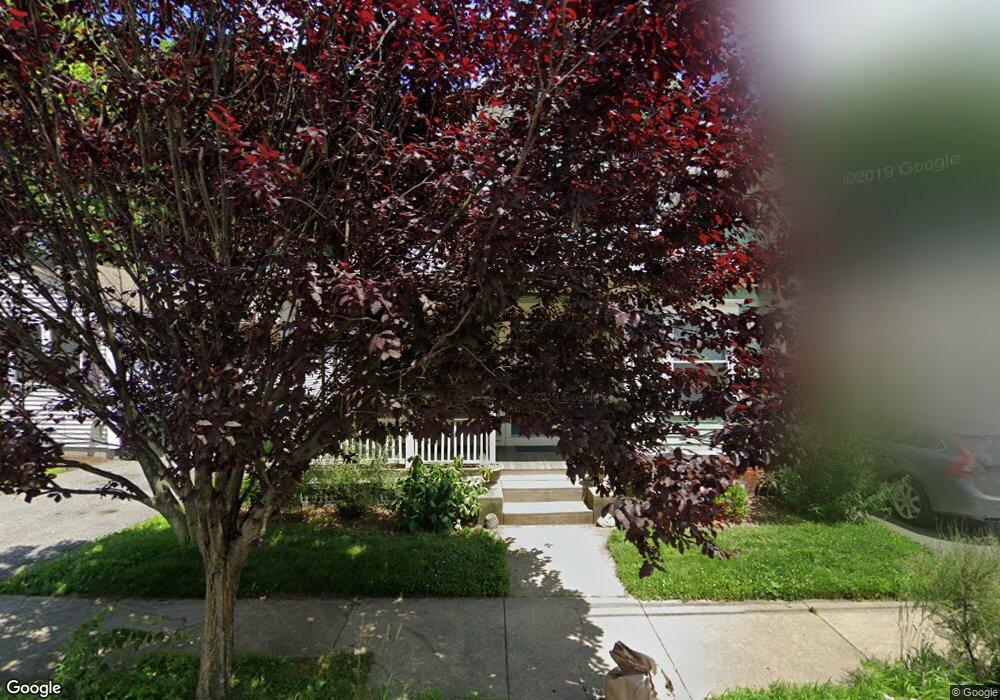
155 Nelson St Providence, RI 02908
Elmhurst NeighborhoodEstimated Value: $429,000 - $516,000
3
Beds
2
Baths
1,499
Sq Ft
$318/Sq Ft
Est. Value
About This Home
This home is located at 155 Nelson St, Providence, RI 02908 and is currently estimated at $476,771, approximately $318 per square foot. 155 Nelson St is a home located in Providence County with nearby schools including St. Pius V Catholic School, St. Augustine School, and Blessed Sacrament School.
Ownership History
Date
Name
Owned For
Owner Type
Purchase Details
Closed on
Apr 8, 2011
Sold by
Morrison Thomas C
Bought by
Morrison Thomas C and Donovan Hannah M
Current Estimated Value
Purchase Details
Closed on
May 24, 2010
Sold by
Beerworth Andrew and Beerworth Julia C
Bought by
Morison Thomas C
Home Financials for this Owner
Home Financials are based on the most recent Mortgage that was taken out on this home.
Original Mortgage
$183,730
Interest Rate
5.23%
Mortgage Type
Purchase Money Mortgage
Purchase Details
Closed on
Sep 30, 2005
Sold by
Wehbe Tarek
Bought by
Beerworth Andrew and Beerworth Julia C
Purchase Details
Closed on
May 19, 2005
Sold by
Wehbe Tarek
Bought by
Machado Ryan C and Frasier Kristie
Purchase Details
Closed on
Aug 20, 2004
Sold by
Kelley Louise E
Bought by
Wehbe Tarek
Create a Home Valuation Report for This Property
The Home Valuation Report is an in-depth analysis detailing your home's value as well as a comparison with similar homes in the area
Home Values in the Area
Average Home Value in this Area
Purchase History
| Date | Buyer | Sale Price | Title Company |
|---|---|---|---|
| Morrison Thomas C | -- | -- | |
| Morison Thomas C | $142,000 | -- | |
| Beerworth Andrew | $230,000 | -- | |
| Machado Ryan C | $210,000 | -- | |
| Wehbe Tarek | $220,000 | -- |
Source: Public Records
Mortgage History
| Date | Status | Borrower | Loan Amount |
|---|---|---|---|
| Open | Wehbe Tarek | $182,200 | |
| Previous Owner | Wehbe Tarek | $183,730 |
Source: Public Records
Tax History
| Year | Tax Paid | Tax Assessment Tax Assessment Total Assessment is a certain percentage of the fair market value that is determined by local assessors to be the total taxable value of land and additions on the property. | Land | Improvement |
|---|---|---|---|---|
| 2025 | $3,281 | $390,600 | $160,000 | $230,600 |
| 2024 | $5,292 | $288,400 | $104,000 | $184,400 |
| 2023 | $5,292 | $288,400 | $104,000 | $184,400 |
| 2022 | $5,134 | $288,400 | $104,000 | $184,400 |
| 2021 | $5,273 | $214,700 | $79,300 | $135,400 |
| 2020 | $5,273 | $214,700 | $79,300 | $135,400 |
| 2019 | $5,359 | $218,200 | $79,300 | $138,900 |
| 2018 | $4,820 | $150,800 | $63,800 | $87,000 |
| 2017 | $4,820 | $150,800 | $63,800 | $87,000 |
| 2016 | $4,820 | $150,800 | $63,800 | $87,000 |
| 2015 | $4,879 | $147,400 | $63,800 | $83,600 |
| 2014 | $4,975 | $147,400 | $63,800 | $83,600 |
| 2013 | $4,975 | $147,400 | $63,800 | $83,600 |
Source: Public Records
Map
Nearby Homes
Your Personal Tour Guide
Ask me questions while you tour the home.