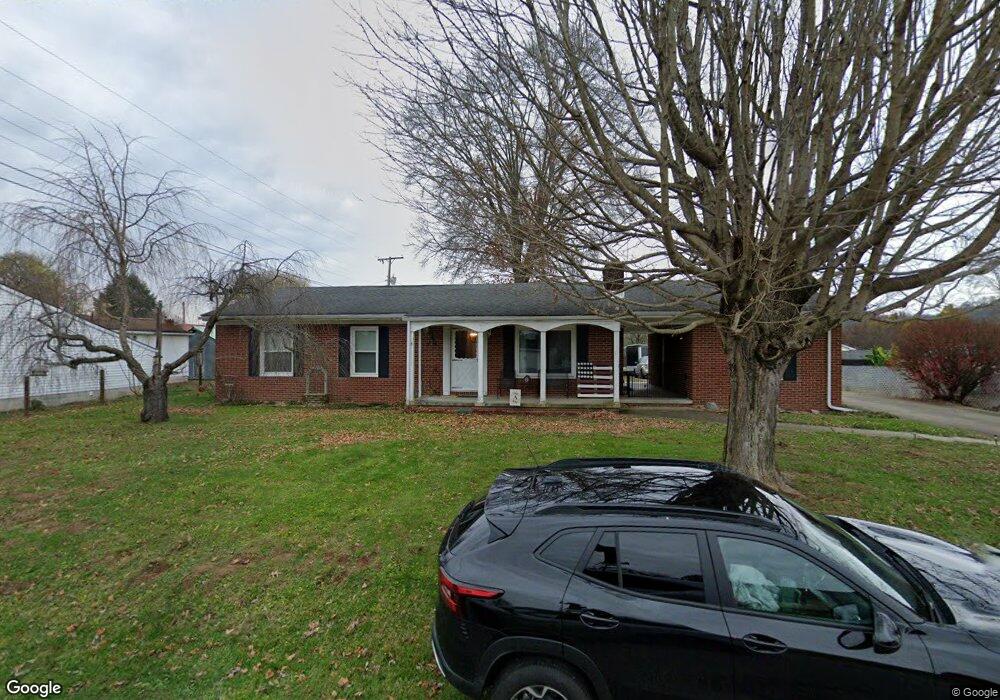
155 Piatt St South Shore, KY 41175
Estimated Value: $109,000 - $138,000
3
Beds
2
Baths
1,246
Sq Ft
$100/Sq Ft
Est. Value
About This Home
This home is located at 155 Piatt St, South Shore, KY 41175 and is currently estimated at $124,289, approximately $99 per square foot. 155 Piatt St is a home located in Greenup County with nearby schools including Greenup County High School.
Ownership History
Date
Name
Owned For
Owner Type
Purchase Details
Closed on
Nov 7, 2022
Sold by
Allen Sarah B and Allen Eric
Bought by
Allen Sarah B and Bradley Austin
Current Estimated Value
Home Financials for this Owner
Home Financials are based on the most recent Mortgage that was taken out on this home.
Original Mortgage
$119,556
Outstanding Balance
$115,499
Interest Rate
6.63%
Mortgage Type
FHA
Estimated Equity
$8,790
Purchase Details
Closed on
Jun 2, 2019
Sold by
Allen Sarah B
Bought by
Allen Sarah B
Home Financials for this Owner
Home Financials are based on the most recent Mortgage that was taken out on this home.
Original Mortgage
$78,011
Interest Rate
4.1%
Mortgage Type
FHA
Purchase Details
Closed on
Jan 27, 2017
Sold by
Fetters Larry and Fetters Judy
Bought by
Patton Sarah B
Create a Home Valuation Report for This Property
The Home Valuation Report is an in-depth analysis detailing your home's value as well as a comparison with similar homes in the area
Home Values in the Area
Average Home Value in this Area
Purchase History
| Date | Buyer | Sale Price | Title Company |
|---|---|---|---|
| Allen Sarah B | -- | None Listed On Document | |
| Allen Sarah B | -- | None Available | |
| Patton Sarah B | $81,500 | None Available |
Source: Public Records
Mortgage History
| Date | Status | Borrower | Loan Amount |
|---|---|---|---|
| Open | Allen Sarah B | $119,556 | |
| Previous Owner | Allen Sarah B | $78,011 |
Source: Public Records
Tax History Compared to Growth
Tax History
| Year | Tax Paid | Tax Assessment Tax Assessment Total Assessment is a certain percentage of the fair market value that is determined by local assessors to be the total taxable value of land and additions on the property. | Land | Improvement |
|---|---|---|---|---|
| 2025 | $1,287 | $75,500 | $10,000 | $65,500 |
| 2024 | $1,284 | $75,500 | $10,000 | $65,500 |
| 2023 | $1,212 | $75,500 | $10,000 | $65,500 |
| 2022 | $1,175 | $75,500 | $10,000 | $65,500 |
| 2021 | $1,170 | $75,500 | $10,000 | $65,500 |
| 2020 | $1,151 | $75,500 | $10,000 | $65,500 |
| 2019 | $1,161 | $75,500 | $10,000 | $65,500 |
| 2018 | $1,190 | $75,500 | $10,000 | $65,500 |
| 2017 | $459 | $67,178 | $10,000 | $57,178 |
| 2016 | $459 | $67,178 | $10,000 | $57,178 |
| 2015 | $456 | $67,178 | $10,000 | $57,178 |
| 2014 | $1,002 | $67,178 | $10,000 | $57,178 |
| 2011 | -- | $67,178 | $10,000 | $57,178 |
Source: Public Records
Map
Nearby Homes