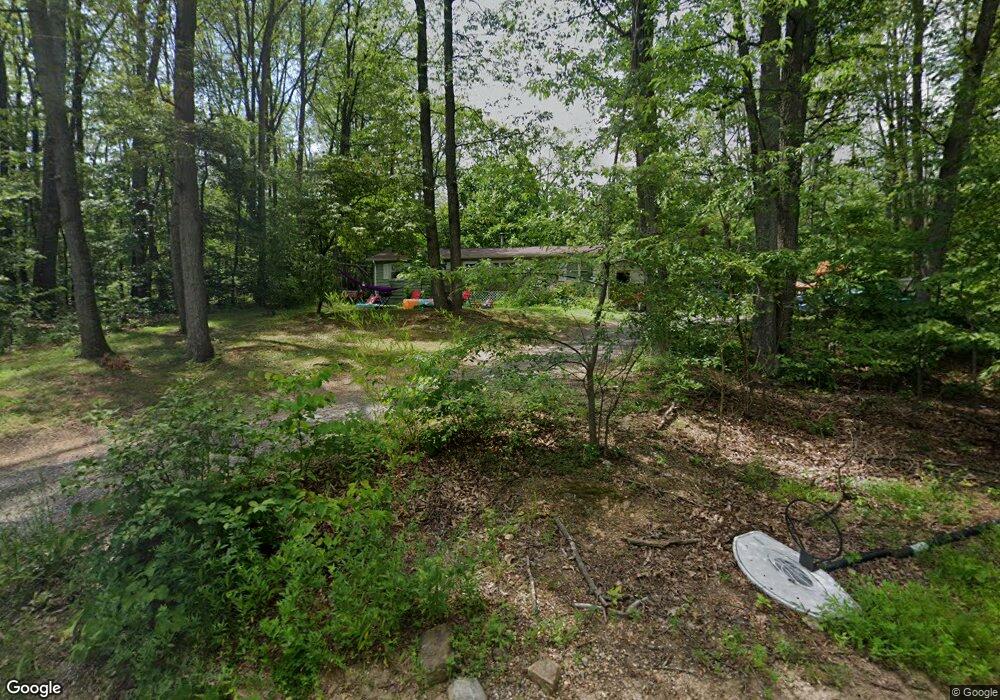
155 Red Fox Trail Winchester, VA 22602
Estimated Value: $241,000 - $269,000
3
Beds
1
Bath
1,128
Sq Ft
$229/Sq Ft
Est. Value
About This Home
This home is located at 155 Red Fox Trail, Winchester, VA 22602 and is currently estimated at $258,635, approximately $229 per square foot. 155 Red Fox Trail is a home located in Frederick County with nearby schools including Indian Hollow Elementary School, Frederick County Middle School, and James Wood High School.
Ownership History
Date
Name
Owned For
Owner Type
Purchase Details
Closed on
Oct 12, 2022
Sold by
Christensen Carley
Bought by
Christensen Carley A and Dunlap Daniel
Current Estimated Value
Home Financials for this Owner
Home Financials are based on the most recent Mortgage that was taken out on this home.
Original Mortgage
$40,500
Outstanding Balance
$34,886
Interest Rate
5.21%
Mortgage Type
New Conventional
Estimated Equity
$223,749
Purchase Details
Closed on
Jul 29, 2022
Sold by
Dean Kephart
Bought by
Christensen Carley
Purchase Details
Closed on
Dec 7, 2017
Sold by
Christensen John O and Christensen Shannon L
Bought by
Christensen Shannon L
Purchase Details
Closed on
Jul 15, 2009
Sold by
Accredited Home Lenders
Bought by
Christensen John O
Home Financials for this Owner
Home Financials are based on the most recent Mortgage that was taken out on this home.
Original Mortgage
$44,000
Interest Rate
5.31%
Mortgage Type
Construction
Purchase Details
Closed on
Aug 29, 2008
Sold by
Specialized Inc Of Va
Bought by
Accredited Home Lenders Inc
Create a Home Valuation Report for This Property
The Home Valuation Report is an in-depth analysis detailing your home's value as well as a comparison with similar homes in the area
Home Values in the Area
Average Home Value in this Area
Purchase History
| Date | Buyer | Sale Price | Title Company |
|---|---|---|---|
| Christensen Carley A | -- | -- | |
| Christensen Carley | -- | -- | |
| Christensen Shannon L | -- | None Available | |
| Christensen John O | $55,000 | -- | |
| Accredited Home Lenders Inc | $112,640 | -- |
Source: Public Records
Mortgage History
| Date | Status | Borrower | Loan Amount |
|---|---|---|---|
| Open | Christensen Carley A | $40,500 | |
| Previous Owner | Christensen John O | $44,000 |
Source: Public Records
Tax History
| Year | Tax Paid | Tax Assessment Tax Assessment Total Assessment is a certain percentage of the fair market value that is determined by local assessors to be the total taxable value of land and additions on the property. | Land | Improvement |
|---|---|---|---|---|
| 2025 | $833 | $173,600 | $58,000 | $115,600 |
| 2024 | $675 | $135,300 | $39,500 | $95,800 |
| 2023 | $690 | $135,300 | $39,500 | $95,800 |
| 2022 | $670 | $109,800 | $33,500 | $76,300 |
| 2021 | $1,330 | $109,800 | $33,500 | $76,300 |
| 2020 | $607 | $99,800 | $33,500 | $66,300 |
| 2019 | $869 | $99,800 | $33,500 | $66,300 |
| 2018 | $1,129 | $93,200 | $33,500 | $59,700 |
| 2017 | $1,119 | $93,200 | $33,500 | $59,700 |
| 2016 | $1,084 | $87,400 | $31,000 | $56,400 |
| 2015 | $489 | $87,400 | $31,000 | $56,400 |
| 2014 | $546 | $85,400 | $31,000 | $54,400 |
Source: Public Records
Map
Nearby Homes
- 0 Poplar Trail
- Lot 33 Falcon Trail
- Lot 13 Tomahawk Trai 0
- 108 Comanche Trail
- 211 Inca Trail
- Lot 133 Tomahawk Trail
- Lot 132 Tomahawk Trail
- Lot 9 Dogwood Trail
- Lot 102 Dogwood Trail
- Lot 101 Dogwood Trail
- 7 Comanche Trail
- 803 Tomahawk Trail
- 115 Dogwood Trail
- 215 Cochise Trail
- 205 Doe Trail
- 111 Genesee Trail
- 701 Hickory Trail
- 166 Graywolf Trail
- LOT 246 Inca Trail
- 129 Indiana Trail
- 154 Geronimo Trail
- 159 Red Fox Trail
- 156 Geronimo Trail
- 152 Geronimo Trail
- 156 Red Fox Trail
- 149 Red Fox Trail
- 152 Red Fox Trail
- 148 Geronimo Trail
- 150 Red Fox Trail
- 146 Red Fox Trail
- 145 Red Fox Trail
- 157 Geronimo Trail
- 312 Falcon Trail
- 141 Erie Trail
- 141 Red Fox Trail
- 147 Geronimo Trail
- 137 Erie Trail
- 139 Red Fox Trail
- 901 Poplar Trail
- 162 Huron Trail
Your Personal Tour Guide
Ask me questions while you tour the home.