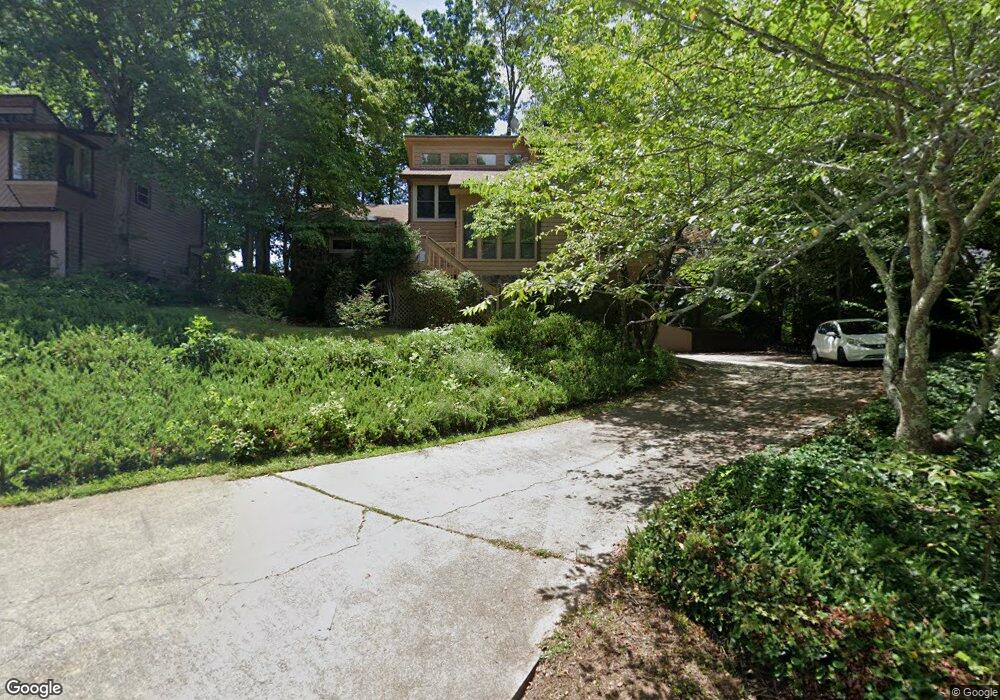
155 Ridge Way Unit 67 Roswell, GA 30076
Estimated Value: $467,000 - $506,000
3
Beds
3
Baths
1,590
Sq Ft
$311/Sq Ft
Est. Value
About This Home
This home is located at 155 Ridge Way Unit 67, Roswell, GA 30076 and is currently estimated at $494,865, approximately $311 per square foot. 155 Ridge Way Unit 67 is a home located in Fulton County with nearby schools including Northwood Elementary School, Haynes Bridge Middle School, and Centennial High School.
Ownership History
Date
Name
Owned For
Owner Type
Purchase Details
Closed on
Nov 7, 2005
Sold by
Desai Mitall N
Bought by
Desai Mitall N and Kansupada Ateet
Current Estimated Value
Home Financials for this Owner
Home Financials are based on the most recent Mortgage that was taken out on this home.
Original Mortgage
$289,300
Outstanding Balance
$159,093
Interest Rate
6.1%
Mortgage Type
New Conventional
Estimated Equity
$335,772
Purchase Details
Closed on
Sep 21, 1994
Sold by
Reinstein Mark E Kelli
Bought by
Malavenda Nelson J Roberta
Home Financials for this Owner
Home Financials are based on the most recent Mortgage that was taken out on this home.
Original Mortgage
$121,500
Interest Rate
8.56%
Create a Home Valuation Report for This Property
The Home Valuation Report is an in-depth analysis detailing your home's value as well as a comparison with similar homes in the area
Home Values in the Area
Average Home Value in this Area
Purchase History
| Date | Buyer | Sale Price | Title Company |
|---|---|---|---|
| Desai Mitall N | -- | -- | |
| Desai Mitali N | $361,700 | -- | |
| Malavenda Nelson J Roberta | $135,000 | -- |
Source: Public Records
Mortgage History
| Date | Status | Borrower | Loan Amount |
|---|---|---|---|
| Open | Desai Mitali N | $289,300 | |
| Previous Owner | Malavenda Nelson J Roberta | $121,500 |
Source: Public Records
Tax History Compared to Growth
Tax History
| Year | Tax Paid | Tax Assessment Tax Assessment Total Assessment is a certain percentage of the fair market value that is determined by local assessors to be the total taxable value of land and additions on the property. | Land | Improvement |
|---|---|---|---|---|
| 2025 | $560 | $153,880 | $45,440 | $108,440 |
| 2023 | $4,539 | $160,800 | $46,200 | $114,600 |
| 2022 | $2,225 | $135,720 | $31,360 | $104,360 |
| 2021 | $2,647 | $116,800 | $27,800 | $89,000 |
| 2020 | $2,685 | $116,560 | $24,560 | $92,000 |
| 2019 | $450 | $119,680 | $33,640 | $86,040 |
| 2018 | $2,504 | $107,040 | $23,040 | $84,000 |
| 2017 | $2,149 | $85,600 | $17,640 | $67,960 |
| 2016 | $2,148 | $85,600 | $17,640 | $67,960 |
| 2015 | $2,623 | $85,600 | $17,640 | $67,960 |
| 2014 | $2,231 | $85,600 | $17,640 | $67,960 |
Source: Public Records
Map
Nearby Homes
- 260 Spring Ridge Dr
- 245 Spring Ridge Trace
- 9195 Nesbit Lakes Dr
- 1250 Atherton Park
- 940 Waters Reach Ct
- 9985 Lake Forest Way
- 650 Lake Forest Ct
- 109 W Ridge Way
- 620 Lake Forest Ct
- 920 Waters Reach Ct
- 1020 Summer Oaks Close Unit 4
- 515 Forest Place
- 1095 Northpointe Trace
- 1220 Terramont Dr
- 680 Barrington Way
- 4040 Declaration Dr
- 2642 Long Pointe
- 167 Ridge Way Unit 167
- 145 Ridge Way Unit 145
- 145 Ridge Way
- 165 Ridge Way
- 8880 Nesbit Lakes Dr
- 8890 Nesbit Lakes Dr Unit 6
- 164 Ridge Way
- 175 Ridge Way
- 160 Ridge Way Unit 4A
- 158 Ridge Way
- 158 Ridge Way Unit 54
- 158 Ridge Way Unit 158
- 150 Ridge Way
- 154 Ridge Way Unit 154
- 170 Ridge Way Unit 4A
- 140 Ridge Way Unit 47
- 8885 Nesbit Lakes Dr
- 8900 Nesbit Lakes Dr Unit 6
- 410 Spring Ridge Trace Unit 4A
- 148 Ridge Way Unit 148