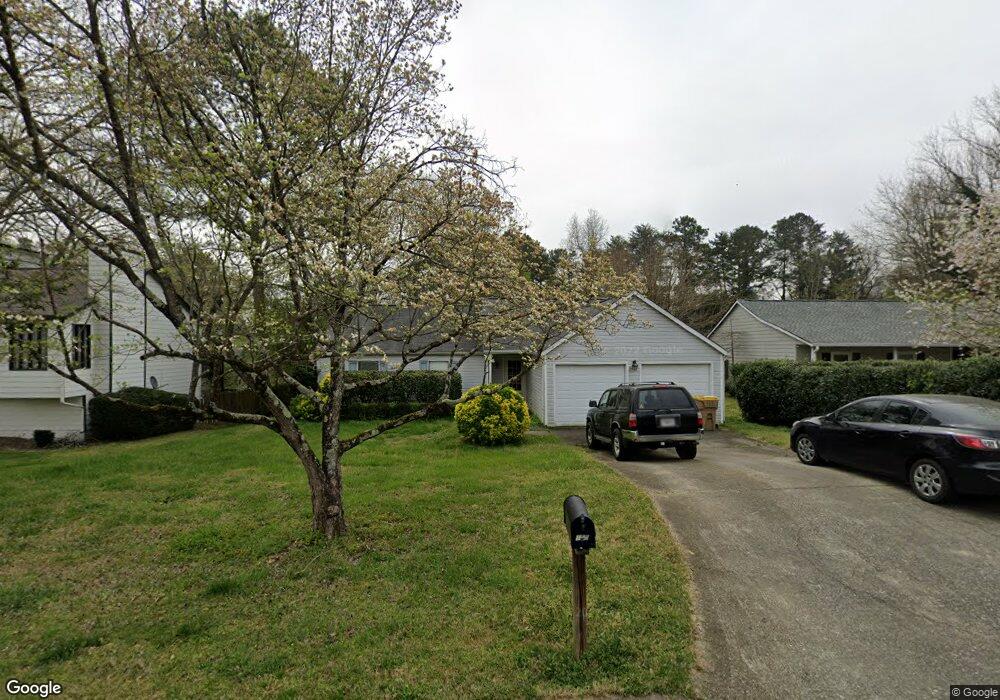
155 Royal Colony Ct Alpharetta, GA 30022
Estimated Value: $426,000 - $452,000
3
Beds
2
Baths
1,412
Sq Ft
$312/Sq Ft
Est. Value
About This Home
This home is located at 155 Royal Colony Ct, Alpharetta, GA 30022 and is currently estimated at $439,901, approximately $311 per square foot. 155 Royal Colony Ct is a home located in Fulton County with nearby schools including Dolvin Elementary School, Autrey Mill Middle School, and Johns Creek High School.
Ownership History
Date
Name
Owned For
Owner Type
Purchase Details
Closed on
Jul 17, 2009
Sold by
Hsbc Mortgage Services Inc
Bought by
Linkous Zach
Current Estimated Value
Home Financials for this Owner
Home Financials are based on the most recent Mortgage that was taken out on this home.
Original Mortgage
$146,202
Outstanding Balance
$95,711
Interest Rate
5.37%
Mortgage Type
FHA
Estimated Equity
$344,190
Purchase Details
Closed on
Feb 3, 2009
Sold by
Strohm Lynda K
Bought by
Hsbc Mortgage Services Inc
Purchase Details
Closed on
Dec 30, 1994
Sold by
Decarlo Val J Terry W
Bought by
Strohm Lynda K
Home Financials for this Owner
Home Financials are based on the most recent Mortgage that was taken out on this home.
Original Mortgage
$86,850
Interest Rate
6.37%
Create a Home Valuation Report for This Property
The Home Valuation Report is an in-depth analysis detailing your home's value as well as a comparison with similar homes in the area
Home Values in the Area
Average Home Value in this Area
Purchase History
| Date | Buyer | Sale Price | Title Company |
|---|---|---|---|
| Linkous Zach | $148,900 | -- | |
| Hsbc Mortgage Services Inc | $123,823 | -- | |
| Strohm Lynda K | $96,500 | -- |
Source: Public Records
Mortgage History
| Date | Status | Borrower | Loan Amount |
|---|---|---|---|
| Open | Linkous Zach | $146,202 | |
| Previous Owner | Strohm Lynda K | $86,850 |
Source: Public Records
Tax History Compared to Growth
Tax History
| Year | Tax Paid | Tax Assessment Tax Assessment Total Assessment is a certain percentage of the fair market value that is determined by local assessors to be the total taxable value of land and additions on the property. | Land | Improvement |
|---|---|---|---|---|
| 2025 | $5,055 | $185,080 | $38,600 | $146,480 |
| 2023 | $4,417 | $156,480 | $39,680 | $116,800 |
| 2022 | $4,051 | $132,000 | $31,560 | $100,440 |
| 2021 | $3,298 | $104,680 | $22,320 | $82,360 |
| 2020 | $2,856 | $88,720 | $21,800 | $66,920 |
| 2019 | $344 | $87,120 | $21,400 | $65,720 |
| 2018 | $2,453 | $75,320 | $20,080 | $55,240 |
| 2017 | $1,744 | $51,240 | $17,320 | $33,920 |
| 2016 | $1,719 | $51,240 | $17,320 | $33,920 |
| 2015 | $1,738 | $51,240 | $17,320 | $33,920 |
| 2014 | $1,511 | $42,840 | $11,080 | $31,760 |
Source: Public Records
Map
Nearby Homes
- 10415 Plantation Bridge Dr
- 10405 Meadow Crest Ln
- 10515 Colony Glen Dr Unit 2
- 115 Thome Dr
- 115 Willow View Point
- 10325 Oxford Mill Cir Unit 1
- 125 Thome Dr
- 120 Thome Dr
- 710 Country Manor Way
- 10050 Lauren Hall Ct
- 350 Waters Bend Way
- 10090 Jones Bridge Rd Unit 8
- 415 Wood Trace Ct
- 235 Wood Shoals Ct
- 170 Autry Trail
- 320 Outwood Mill Ct
- 10000 Barston Ct
- 3815 Falls Landing Dr
- 285 Rolling Mist Ct
- 125 Sandridge Ct
- 165 Royal Colony Ct
- 145 Royal Colony Ct Unit 1
- 145 Royal Colony Ct
- 135 Royal Colony Ct Unit 1
- 10340 Colony Glen Dr
- 10330 Colony Glen Dr Unit 1
- 140 Royal Colony Ct
- 150 Royal Colony Ct Unit 1
- 160 Royal Colony Ct
- 170 Royal Colony Ct Unit 1
- 130 Royal Colony Ct Unit 1
- 125 Royal Colony Ct
- 120 Royal Colony Ct
- 10355 Colony Glen Dr Unit 1
- 10345 Colony Glen Dr Unit 1
- 10370 Colony Glen Dr
- 115 Royal Colony Ct
- 10375 Colony Glen Dr
- 10405 Plantation Bridge Dr
- 110 Royal Colony Ct