Estimated Value: $368,000 - $418,000
Studio
--
Bath
1,025
Sq Ft
$383/Sq Ft
Est. Value
About This Home
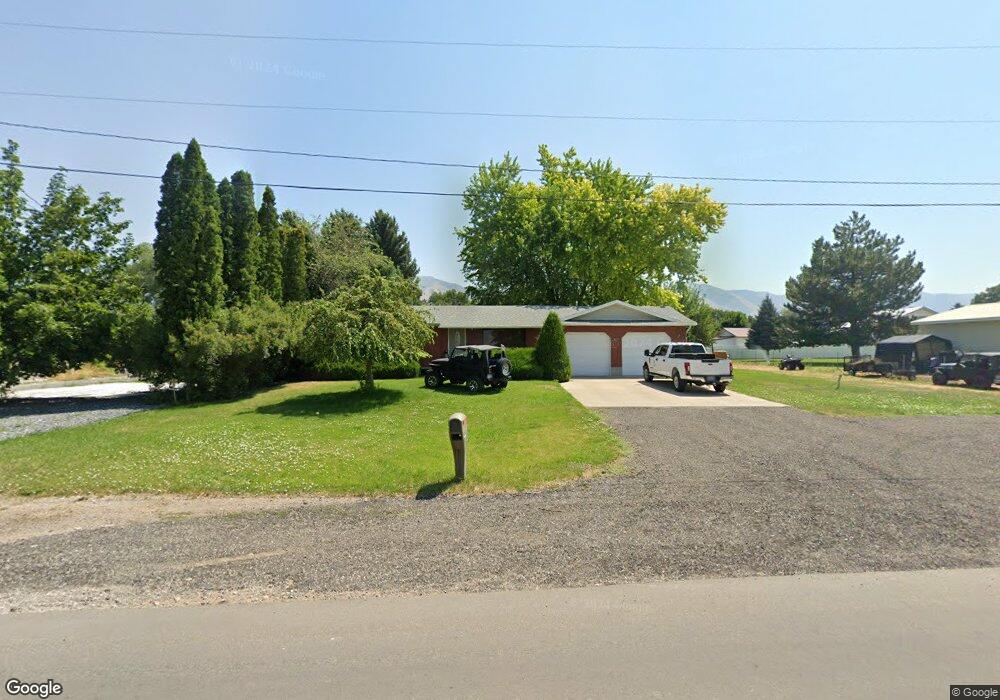
This home is located at 155 S 100 E, Hyrum, UT 84319 and is currently estimated at $392,691, approximately $383 per square foot. 155 S 100 E is a home with nearby schools including Lincoln School, South Cache Middle School, and Mountain Crest High School.
Ownership History
Date
Name
Owned For
Owner Type
Purchase Details
Closed on
Nov 26, 2012
Sold by
Nielsen Kurt W
Bought by
Wdn Investments Llc
Current Estimated Value
Purchase Details
Closed on
Sep 14, 2012
Sold by
Brower Susan N
Bought by
Wdn Investments Llc
Purchase Details
Closed on
Aug 15, 2012
Sold by
Nielsen Kelly Derle
Bought by
Wdn Investments Llc
Purchase Details
Closed on
Mar 14, 2012
Sold by
Nielsen Kelly Derle and Nielsen Tracy W
Bought by
Nielsen Kelly Derle and Nielsen Kurt W
Purchase Details
Closed on
Sep 18, 2002
Sold by
Nielsen Weldon Derle and Derle Nielsen W
Bought by
Nielsen W Derle
Create a Home Valuation Report for This Property
The Home Valuation Report is an in-depth analysis detailing your home's value as well as a comparison with similar homes in the area
Home Values in the Area
Average Home Value in this Area
Purchase History
| Date | Buyer | Sale Price | Title Company |
|---|---|---|---|
| Wdn Investments Llc | -- | United West Title | |
| Wdn Investments Llc | -- | United West Title | |
| Wdn Investments Llc | -- | United West Title | |
| Nielsen Kelly Derle | -- | United West Title | |
| Nielsen W Derle | -- | -- |
Source: Public Records
Tax History
| Year | Tax Paid | Tax Assessment Tax Assessment Total Assessment is a certain percentage of the fair market value that is determined by local assessors to be the total taxable value of land and additions on the property. | Land | Improvement |
|---|---|---|---|---|
| 2025 | $1,600 | $229,675 | $0 | $0 |
| 2023 | $1,651 | $211,650 | $0 | $0 |
| 2022 | $1,723 | $211,650 | $0 | $0 |
| 2021 | $1,613 | $305,370 | $78,390 | $226,980 |
| 2020 | $1,424 | $252,990 | $78,390 | $174,600 |
| 2019 | $1,420 | $237,170 | $62,570 | $174,600 |
| 2018 | $1,081 | $174,570 | $62,570 | $112,000 |
| 2017 | $1,067 | $89,415 | $0 | $0 |
| 2016 | $1,091 | $89,415 | $0 | $0 |
| 2015 | $1,094 | $89,415 | $0 | $0 |
| 2014 | $1,068 | $89,250 | $0 | $0 |
| 2013 | -- | $70,640 | $0 | $0 |
Source: Public Records
Map
Nearby Homes
Your Personal Tour Guide
Ask me questions while you tour the home.