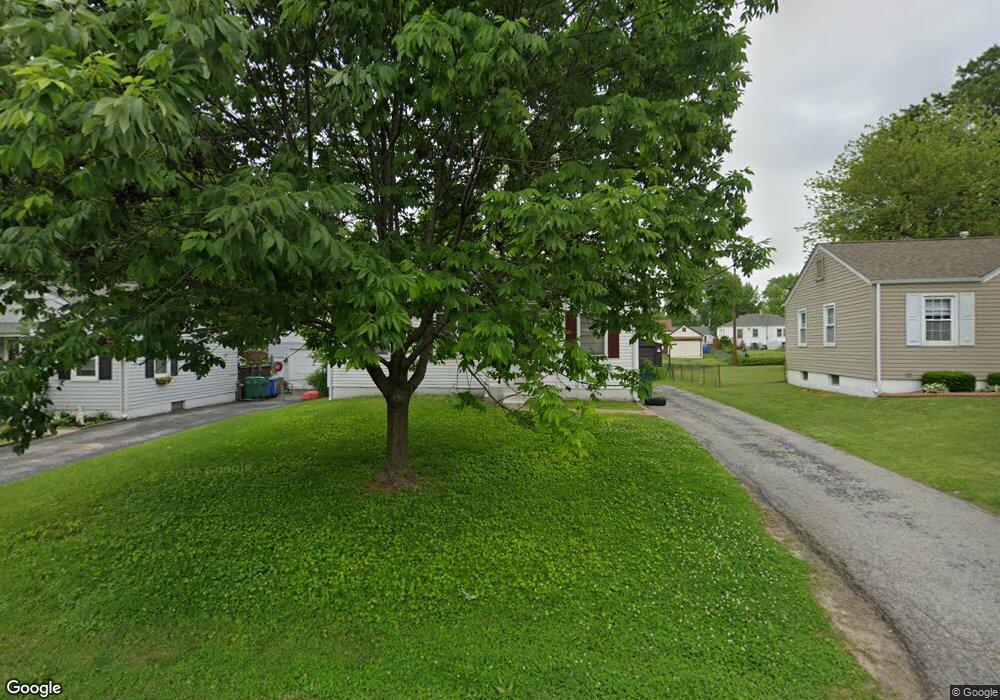
155 Saint Luke Dr Florissant, MO 63031
Estimated Value: $116,000 - $134,000
2
Beds
1
Bath
792
Sq Ft
$157/Sq Ft
Est. Value
About This Home
This home is located at 155 Saint Luke Dr, Florissant, MO 63031 and is currently estimated at $124,155, approximately $156 per square foot. 155 Saint Luke Dr is a home located in St. Louis County with nearby schools including Duchesne Elementary School, Cross Keys Middle School, and McCluer North High School.
Ownership History
Date
Name
Owned For
Owner Type
Purchase Details
Closed on
Nov 16, 2012
Sold by
New Vision Group Llc
Bought by
Alon Holdings Llc
Current Estimated Value
Purchase Details
Closed on
Sep 25, 2012
Sold by
Secretary Of Housing & Urban Development
Bought by
New Vision Group Llc
Purchase Details
Closed on
Jun 15, 2012
Sold by
Bank Of America Na
Bought by
Secretary Of Housing & Urban Development
Purchase Details
Closed on
Jun 8, 2012
Sold by
Crowley Joseph
Bought by
Bank Of America Na
Purchase Details
Closed on
Dec 1, 2010
Sold by
Crowley Joseph A
Bought by
Vantage Credit Union
Purchase Details
Closed on
Oct 28, 1997
Sold by
Ruble Katherine L
Bought by
Crowley Joseph A
Home Financials for this Owner
Home Financials are based on the most recent Mortgage that was taken out on this home.
Original Mortgage
$59,509
Interest Rate
7.33%
Mortgage Type
FHA
Create a Home Valuation Report for This Property
The Home Valuation Report is an in-depth analysis detailing your home's value as well as a comparison with similar homes in the area
Home Values in the Area
Average Home Value in this Area
Purchase History
| Date | Buyer | Sale Price | Title Company |
|---|---|---|---|
| Alon Holdings Llc | $40,000 | None Available | |
| New Vision Group Llc | $40,700 | None Available | |
| Secretary Of Housing & Urban Development | $36,113 | None Available | |
| Bank Of America Na | $48,533 | None Available | |
| Vantage Credit Union | $11,866 | None Available | |
| Crowley Joseph A | -- | -- |
Source: Public Records
Mortgage History
| Date | Status | Borrower | Loan Amount |
|---|---|---|---|
| Previous Owner | Crowley Joseph A | $59,509 |
Source: Public Records
Tax History Compared to Growth
Tax History
| Year | Tax Paid | Tax Assessment Tax Assessment Total Assessment is a certain percentage of the fair market value that is determined by local assessors to be the total taxable value of land and additions on the property. | Land | Improvement |
|---|---|---|---|---|
| 2025 | $1,479 | $23,560 | $5,620 | $17,940 |
| 2024 | $1,479 | $18,870 | $2,890 | $15,980 |
| 2023 | $1,474 | $18,870 | $2,890 | $15,980 |
| 2022 | $1,469 | $16,550 | $3,210 | $13,340 |
| 2021 | $1,444 | $16,550 | $3,210 | $13,340 |
| 2020 | $1,210 | $13,060 | $3,710 | $9,350 |
| 2019 | $1,187 | $13,060 | $3,710 | $9,350 |
| 2018 | $1,114 | $10,940 | $2,090 | $8,850 |
| 2017 | $1,109 | $10,940 | $2,090 | $8,850 |
| 2016 | $1,122 | $10,790 | $2,470 | $8,320 |
| 2015 | $1,128 | $10,790 | $2,470 | $8,320 |
| 2014 | $1,272 | $12,600 | $3,380 | $9,220 |
Source: Public Records
Map
Nearby Homes
- 215 Derhake Rd
- 1205 Saint Matthew Dr
- 38 Spring Dr
- 150 Saint Daniel Ln
- 24 Valley Dr
- 14 Saint Martha Ct
- 250 Maple Dr
- 270 W Saint Anthony Ln
- 4000 Washington St
- 215 Maple Dr
- 165 Maple Dr
- 805 Derhake Rd
- 840 Pershall Rd
- 785 Bobbins Ln
- 45 Chateau Dr
- 105 Capri Dr
- 2320 Allen Dr
- 1811 S New Florissant Rd
- 1815 S New Florissant Rd
- 2240 Brook Dr
- 165 Saint Luke Dr
- 145 Saint Luke Dr
- 135 Saint Luke Dr
- 160 Derhake Rd
- 150 Derhake Rd
- 170 Derhake Rd
- 140 Derhake Rd
- 185 Saint Luke Dr
- 180 Derhake Rd
- 160 Saint Luke Dr
- 150 Saint Luke Dr
- 1110 Saint Matthew Dr
- 195 Saint Luke Dr
- 190 Derhake Rd
- 1090 Saint Matthew Dr
- 1140 Saint Matthew Dr
- 1080 Saint Matthew Dr
- 1070 Saint Matthew Dr
- 200 Derhake Rd
- 1150 Saint Matthew Dr