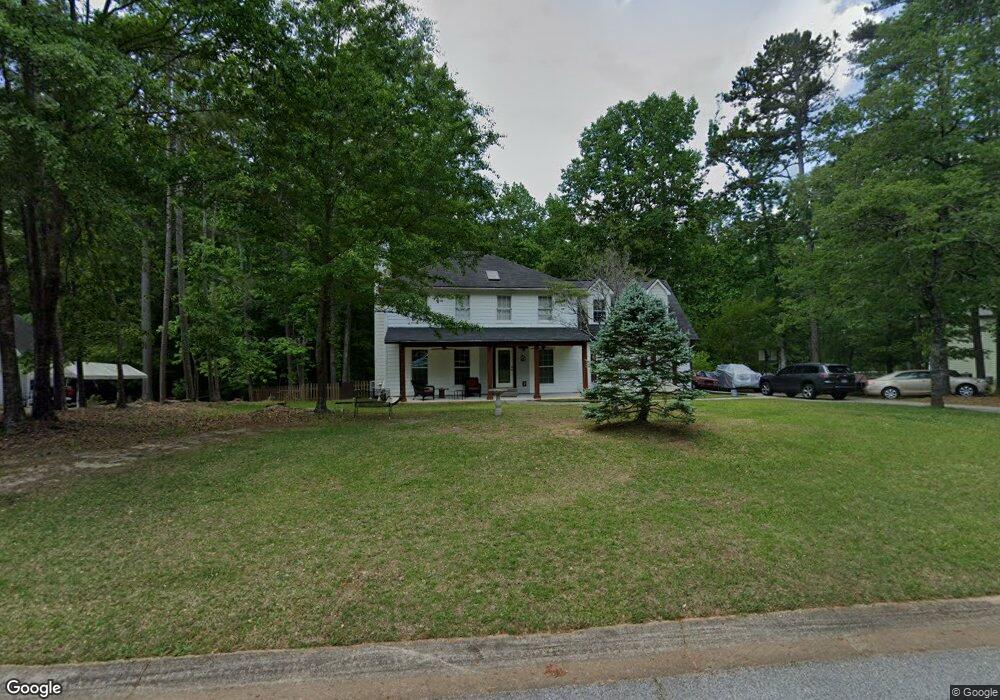
155 Stafford Ct Unit 42 Fayetteville, GA 30215
Estimated Value: $301,000 - $375,000
3
Beds
3
Baths
2,200
Sq Ft
$152/Sq Ft
Est. Value
About This Home
This home is located at 155 Stafford Ct Unit 42, Fayetteville, GA 30215 and is currently estimated at $333,884, approximately $151 per square foot. 155 Stafford Ct Unit 42 is a home located in Fayette County with nearby schools including Inman Elementary School, Whitewater Middle School, and Whitewater High School.
Ownership History
Date
Name
Owned For
Owner Type
Purchase Details
Closed on
Jan 26, 2017
Sold by
Cox Gregory Darrell
Bought by
Torres Vincente
Current Estimated Value
Home Financials for this Owner
Home Financials are based on the most recent Mortgage that was taken out on this home.
Original Mortgage
$141,300
Outstanding Balance
$117,381
Interest Rate
4.32%
Mortgage Type
New Conventional
Estimated Equity
$216,503
Purchase Details
Closed on
Feb 18, 2016
Sold by
Cox Kerstin
Bought by
Cox Gregory D
Purchase Details
Closed on
Sep 7, 2012
Sold by
Cox Gregory Darrell
Bought by
Cox Gregory Darrell and Cox Kerstin
Home Financials for this Owner
Home Financials are based on the most recent Mortgage that was taken out on this home.
Original Mortgage
$100,761
Interest Rate
3.63%
Mortgage Type
New Conventional
Purchase Details
Closed on
Mar 2, 1996
Sold by
Owen Al Donna
Bought by
Cox Gregory
Create a Home Valuation Report for This Property
The Home Valuation Report is an in-depth analysis detailing your home's value as well as a comparison with similar homes in the area
Home Values in the Area
Average Home Value in this Area
Purchase History
| Date | Buyer | Sale Price | Title Company |
|---|---|---|---|
| Torres Vincente | $157,000 | -- | |
| Cox Gregory D | -- | -- | |
| Cox Gregory Darrell | -- | -- | |
| Cox Gregory | $119,900 | -- |
Source: Public Records
Mortgage History
| Date | Status | Borrower | Loan Amount |
|---|---|---|---|
| Open | Torres Vincente | $141,300 | |
| Previous Owner | Cox Gregory Darrell | $100,761 | |
| Closed | Cox Gregory | $0 |
Source: Public Records
Tax History Compared to Growth
Tax History
| Year | Tax Paid | Tax Assessment Tax Assessment Total Assessment is a certain percentage of the fair market value that is determined by local assessors to be the total taxable value of land and additions on the property. | Land | Improvement |
|---|---|---|---|---|
| 2024 | $3,097 | $114,092 | $20,000 | $94,092 |
| 2023 | $3,052 | $109,520 | $20,000 | $89,520 |
| 2022 | $2,917 | $104,880 | $20,000 | $84,880 |
| 2021 | $2,428 | $86,080 | $20,000 | $66,080 |
| 2020 | $2,006 | $70,760 | $12,800 | $57,960 |
| 2019 | $2,080 | $72,600 | $12,800 | $59,800 |
| 2018 | $1,820 | $62,800 | $12,400 | $50,400 |
| 2017 | $1,667 | $60,040 | $12,800 | $47,240 |
| 2016 | $1,530 | $54,200 | $12,800 | $41,400 |
| 2015 | $1,449 | $50,600 | $12,800 | $37,800 |
| 2014 | $1,361 | $46,880 | $12,800 | $34,080 |
| 2013 | -- | $46,640 | $0 | $0 |
Source: Public Records
Map
Nearby Homes
- 150 Melody Ln
- 115 Granby Ln
- 165 Forest Lake Dr
- 140 Forest Lake Dr
- 135 Bryson Ln
- 145 Bryson Ln
- 175 Forest Lake Dr
- 106 Carrollwood Dr
- 175 Kingswood Dr
- 100 Carrollwood Dr
- 0 Mcbride Rd Unit LOT 3 10607237
- 0 Mcbride Rd Unit LOT 2 10607045
- 220 Essex Cir
- 105 Greenfield Cir
- 100 Parliament Ct
- 380 Stoneridge Way
- 390 Stoneridge Way
- 315 Royal Ridge Way
- 130 Wright Trace Unit LOT 20
- 215 Watershed Way
- 155 Stafford Ct
- 165 Stafford Ct
- 145 Stafford Ct Unit 43
- 145 Stafford Ct
- 200 Sheffield Ct
- 150 Stafford Ct
- 135 Stafford Ct
- 140 Stafford Ct
- 190 Sheffield Ct
- 175 Stafford Ct
- 0 Stafford Ct Unit 8634535
- 0 Stafford Ct Unit 8623996
- 0 Stafford Ct Unit 8556394
- 0 Stafford Ct Unit 8471020
- 0 Stafford Ct Unit 8112914
- 0 Stafford Ct Unit 8400483
- 0 Stafford Ct Unit 3225477
- 205 Sheffield Ct
- 130 Stafford Ct
- 160 Stafford Ct