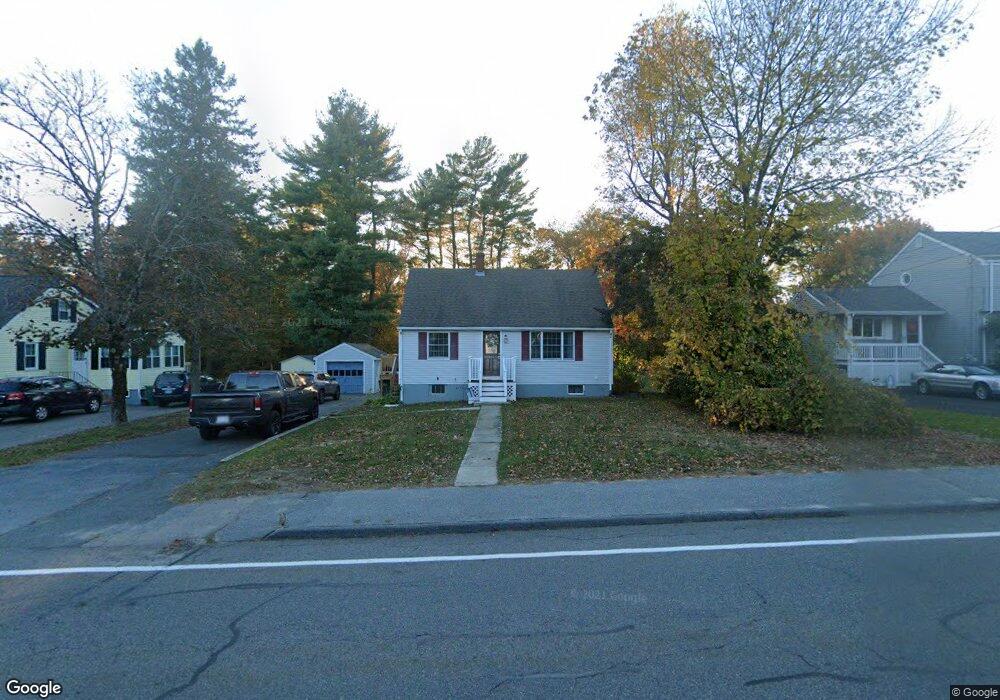
155 Sycamore St Holbrook, MA 02343
Estimated Value: $539,000 - $638,000
3
Beds
2
Baths
1,344
Sq Ft
$439/Sq Ft
Est. Value
About This Home
This home is located at 155 Sycamore St, Holbrook, MA 02343 and is currently estimated at $590,322, approximately $439 per square foot. 155 Sycamore St is a home located in Norfolk County with nearby schools including John F. Kennedy Elementary School, Holbrook Middle High School, and Boston Higashi School.
Ownership History
Date
Name
Owned For
Owner Type
Purchase Details
Closed on
Jun 27, 2011
Sold by
Doherty Michael J and Doherty Julie A
Bought by
Boyle James F
Current Estimated Value
Home Financials for this Owner
Home Financials are based on the most recent Mortgage that was taken out on this home.
Original Mortgage
$209,549
Outstanding Balance
$144,977
Interest Rate
4.63%
Mortgage Type
Purchase Money Mortgage
Estimated Equity
$445,345
Purchase Details
Closed on
Nov 27, 2002
Sold by
Mesina Laura J
Bought by
Doherty Michael J and Doherty Julie A
Purchase Details
Closed on
Oct 6, 1997
Sold by
Housing & Urban Dev
Bought by
Messina John M
Purchase Details
Closed on
Apr 9, 1997
Sold by
Bankers Tr Co Tr
Bought by
Department Of Housing & Urban Dev
Purchase Details
Closed on
Nov 6, 1996
Sold by
Est Ganzel Peter L
Bought by
Bankers Trust Co
Create a Home Valuation Report for This Property
The Home Valuation Report is an in-depth analysis detailing your home's value as well as a comparison with similar homes in the area
Home Values in the Area
Average Home Value in this Area
Purchase History
| Date | Buyer | Sale Price | Title Company |
|---|---|---|---|
| Boyle James F | $215,000 | -- | |
| Doherty Michael J | $279,900 | -- | |
| Messina John M | $116,000 | -- | |
| Messina John M | $116,000 | -- | |
| Department Of Housing & Urban Dev | $116,789 | -- | |
| Bankers Trust Co | $134,181 | -- | |
| Bankers Trust Co | $134,181 | -- |
Source: Public Records
Mortgage History
| Date | Status | Borrower | Loan Amount |
|---|---|---|---|
| Open | Boyle James F | $209,549 | |
| Previous Owner | Bankers Trust Co | $344,815 | |
| Previous Owner | Bankers Trust Co | $31,550 |
Source: Public Records
Tax History Compared to Growth
Tax History
| Year | Tax Paid | Tax Assessment Tax Assessment Total Assessment is a certain percentage of the fair market value that is determined by local assessors to be the total taxable value of land and additions on the property. | Land | Improvement |
|---|---|---|---|---|
| 2025 | $71 | $535,800 | $300,400 | $235,400 |
| 2024 | $6,586 | $490,000 | $259,400 | $230,600 |
| 2023 | $7,155 | $465,200 | $248,300 | $216,900 |
| 2022 | $6,378 | $386,800 | $211,600 | $175,200 |
| 2021 | $6,306 | $366,200 | $197,800 | $168,400 |
| 2020 | $6,196 | $337,300 | $182,400 | $154,900 |
| 2019 | $6,258 | $321,600 | $173,700 | $147,900 |
| 2018 | $5,881 | $284,500 | $142,000 | $142,500 |
| 2017 | $5,507 | $263,500 | $129,100 | $134,400 |
| 2016 | $5,077 | $258,500 | $126,800 | $131,700 |
| 2015 | $4,701 | $246,400 | $117,400 | $129,000 |
| 2014 | $4,625 | $246,400 | $117,400 | $129,000 |
Source: Public Records
Map
Nearby Homes
- 71 Stevens Dr
- 45-R Ernest St
- 169 Pond St
- 16 Loud Rd
- 22 Medallion Rd
- 360 Plymouth St
- 278 Sycamore St
- 27 Arnold St
- 19 Bradford St
- 181 S Franklin St Unit 102
- 181 S Franklin St Unit 207
- 152 S Franklin St
- 148 N Franklin St
- 35 Rindone St
- 375 S Franklin St Unit 1
- 45 King Rd
- 27 Winter St
- 373 N Franklin St
- 34 Reeds Ln
- 44 Old Forge Rd
- 159 Sycamore St
- 151 Sycamore St
- 147 Sycamore St
- 163 Sycamore St
- 186 Sycamore St
- 94 Stevens Dr
- 143 Sycamore St
- 192 Sycamore St
- 8 Gioioso Dr
- 167 Sycamore St
- 90 Stevens Dr
- 13 Gioioso Dr
- 139 Sycamore St
- 171 Sycamore St
- 67 Stevens Dr
- 4 Gioioso Dr
- 86 Stevens Dr
- 126 Sycamore St
- 63 Stevens Dr
- 131 Sycamore St