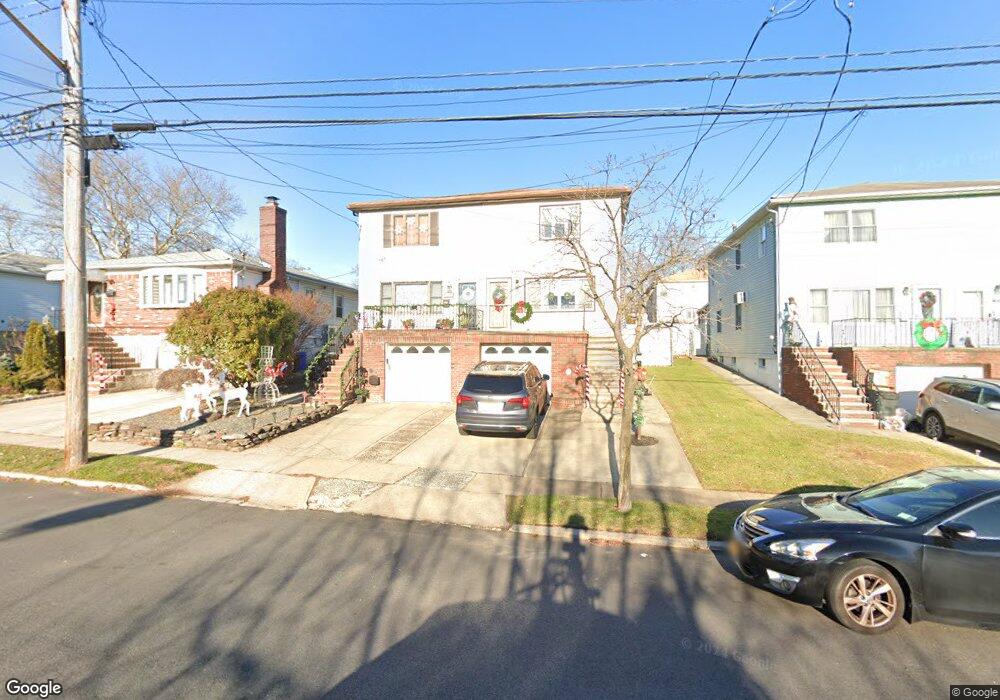
155 Tysens Ln Staten Island, NY 10306
New Dorp NeighborhoodEstimated Value: $654,000 - $726,000
3
Beds
2
Baths
1,292
Sq Ft
$542/Sq Ft
Est. Value
About This Home
This home is located at 155 Tysens Ln, Staten Island, NY 10306 and is currently estimated at $700,094, approximately $541 per square foot. 155 Tysens Ln is a home located in Richmond County with nearby schools including P.S. 23 Richmondtown, Myra S. Barnes Intermediate School 24, and New Dorp High School.
Ownership History
Date
Name
Owned For
Owner Type
Purchase Details
Closed on
Jul 13, 2010
Sold by
Rao Anthony and Rao Lisa A
Bought by
Brewer Mark and Brewer Christina T
Current Estimated Value
Home Financials for this Owner
Home Financials are based on the most recent Mortgage that was taken out on this home.
Original Mortgage
$394,685
Outstanding Balance
$262,666
Interest Rate
4.75%
Mortgage Type
FHA
Estimated Equity
$437,428
Purchase Details
Closed on
Apr 6, 2004
Sold by
Malverty Leroy T and Malverty Lucy
Bought by
Rao Anthony and Rao Lisa A
Home Financials for this Owner
Home Financials are based on the most recent Mortgage that was taken out on this home.
Original Mortgage
$308,000
Interest Rate
6.25%
Mortgage Type
Purchase Money Mortgage
Purchase Details
Closed on
Jul 23, 1997
Sold by
Longo Vincent and Longo Deanna M
Bought by
Malverty Leroy T and Malverty Lucy
Home Financials for this Owner
Home Financials are based on the most recent Mortgage that was taken out on this home.
Original Mortgage
$178,480
Interest Rate
7.7%
Create a Home Valuation Report for This Property
The Home Valuation Report is an in-depth analysis detailing your home's value as well as a comparison with similar homes in the area
Home Values in the Area
Average Home Value in this Area
Purchase History
| Date | Buyer | Sale Price | Title Company |
|---|---|---|---|
| Brewer Mark | $400,000 | Commonwealth Land Title Insu | |
| Rao Anthony | $385,500 | Commonwealth Land Title Insu | |
| Malverty Leroy T | $18,000 | First American Title Ins Co |
Source: Public Records
Mortgage History
| Date | Status | Borrower | Loan Amount |
|---|---|---|---|
| Open | Brewer Mark | $394,685 | |
| Previous Owner | Rao Anthony | $308,000 | |
| Previous Owner | Malverty Leroy T | $178,480 |
Source: Public Records
Tax History Compared to Growth
Tax History
| Year | Tax Paid | Tax Assessment Tax Assessment Total Assessment is a certain percentage of the fair market value that is determined by local assessors to be the total taxable value of land and additions on the property. | Land | Improvement |
|---|---|---|---|---|
| 2025 | $5,761 | $39,300 | $6,702 | $32,598 |
| 2024 | $3,527 | $32,640 | $7,857 | $24,783 |
| 2023 | $3,591 | $28,685 | $7,433 | $21,252 |
| 2022 | $5,507 | $34,620 | $8,940 | $25,680 |
| 2021 | $5,477 | $34,860 | $8,940 | $25,920 |
| 2020 | $5,197 | $30,060 | $8,940 | $21,120 |
| 2019 | $5,000 | $30,720 | $8,940 | $21,780 |
| 2018 | $4,873 | $23,904 | $7,950 | $15,954 |
| 2017 | $4,686 | $22,988 | $7,628 | $15,360 |
| 2016 | $4,335 | $21,687 | $7,394 | $14,293 |
| 2015 | $3,823 | $20,460 | $7,620 | $12,840 |
| 2014 | $3,823 | $19,920 | $7,620 | $12,300 |
Source: Public Records
Map
Nearby Homes