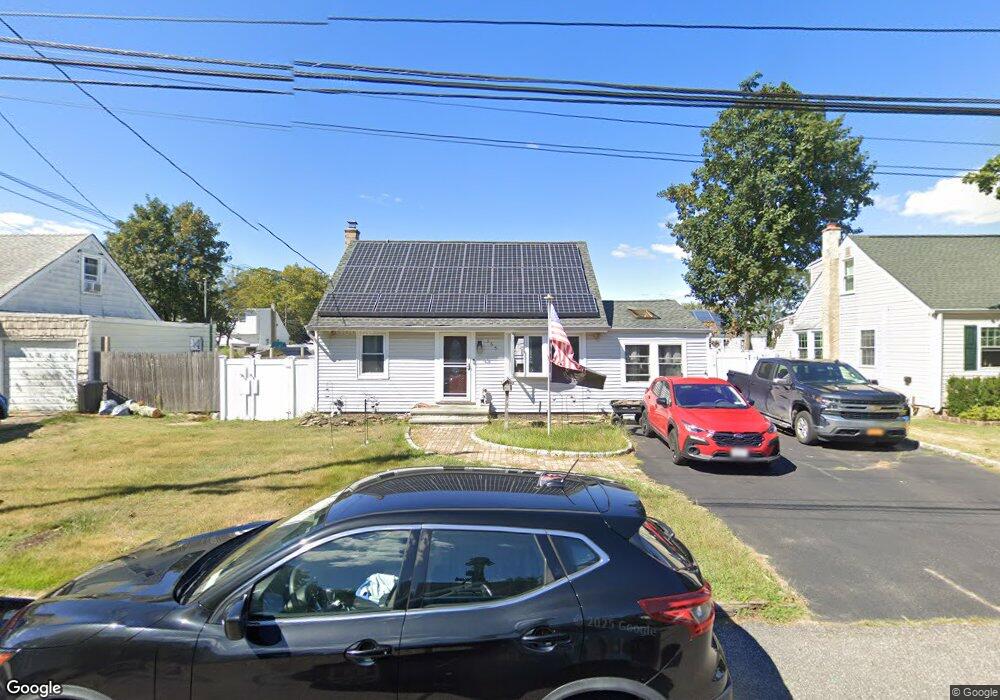
155 Van Buren St West Babylon, NY 11704
Estimated Value: $599,960 - $749,000
4
Beds
2
Baths
1,443
Sq Ft
$450/Sq Ft
Est. Value
About This Home
This home is located at 155 Van Buren St, West Babylon, NY 11704 and is currently estimated at $649,740, approximately $450 per square foot. 155 Van Buren St is a home located in Suffolk County with nearby schools including Robert Moses Middle School and North Babylon High School.
Ownership History
Date
Name
Owned For
Owner Type
Purchase Details
Closed on
Dec 9, 2015
Sold by
Ege Richard J and Scott Linda H
Bought by
Benson Timothy and Geraghty Laura
Current Estimated Value
Home Financials for this Owner
Home Financials are based on the most recent Mortgage that was taken out on this home.
Original Mortgage
$314,204
Outstanding Balance
$253,575
Interest Rate
4.5%
Mortgage Type
FHA
Estimated Equity
$396,165
Purchase Details
Closed on
Jan 13, 2006
Sold by
Battista Beth
Bought by
Scott Linda H
Purchase Details
Closed on
Jan 18, 2002
Sold by
Pepi Anthony R and Pepi Lynette
Bought by
Battista Vito and Battista Beth
Home Financials for this Owner
Home Financials are based on the most recent Mortgage that was taken out on this home.
Original Mortgage
$175,000
Interest Rate
7.15%
Purchase Details
Closed on
Jul 21, 1995
Sold by
Wisdom Patricia
Bought by
Pepi Anthony R and Pepi Lynette
Create a Home Valuation Report for This Property
The Home Valuation Report is an in-depth analysis detailing your home's value as well as a comparison with similar homes in the area
Home Values in the Area
Average Home Value in this Area
Purchase History
| Date | Buyer | Sale Price | Title Company |
|---|---|---|---|
| Benson Timothy | $320,000 | None Available | |
| Scott Linda H | $400,000 | Richard Artura | |
| Battista Vito | $235,000 | Commonwealth Land Title Ins | |
| Pepi Anthony R | $115,000 | First American Title Ins Co |
Source: Public Records
Mortgage History
| Date | Status | Borrower | Loan Amount |
|---|---|---|---|
| Open | Benson Timothy | $314,204 | |
| Previous Owner | Battista Vito | $175,000 |
Source: Public Records
Tax History Compared to Growth
Tax History
| Year | Tax Paid | Tax Assessment Tax Assessment Total Assessment is a certain percentage of the fair market value that is determined by local assessors to be the total taxable value of land and additions on the property. | Land | Improvement |
|---|---|---|---|---|
| 2024 | $10,712 | $3,080 | $240 | $2,840 |
| 2023 | $10,712 | $3,080 | $240 | $2,840 |
| 2022 | $7,118 | $3,080 | $240 | $2,840 |
| 2021 | $7,118 | $3,080 | $240 | $2,840 |
| 2020 | $9,597 | $3,080 | $240 | $2,840 |
| 2019 | $9,597 | $0 | $0 | $0 |
| 2018 | $9,440 | $3,080 | $240 | $2,840 |
| 2017 | $9,440 | $3,080 | $240 | $2,840 |
| 2016 | $8,268 | $2,700 | $240 | $2,460 |
| 2015 | -- | $2,700 | $240 | $2,460 |
| 2014 | -- | $2,700 | $240 | $2,460 |
Source: Public Records
Map
Nearby Homes
- 155 Throop St
- 185 Throop St
- 111 Sherbrooke Rd
- 56 Suffolk Ave
- 501 Windmill Ave
- 652 Empire Ave
- 651 Windmill Ave
- 21 Silver St
- 130 Claremont Ave
- 64 Montgomery Ave
- 332 Marcy St
- 209 Claremont Ave
- 135 Westchester Ave
- 45 Amsterdam Ave
- 1565 10th St
- 1568 7th St
- 1558 9th St
- 1599 3rd St
- 1538 10th St
- 270 Fulton St
- 157 Van Buren St
- 153 Van Buren St
- 154 Throop St
- 152 Throop St
- 156 Throop St
- 151 Van Buren St
- 154 Van Buren St
- 150 Throop St
- 156 Van Buren St
- 152 Van Buren St
- 161 Van Buren St
- 158 Van Buren St
- 150 Van Buren St
- 160 Throop St
- 160 Van Buren St
- 163 Van Buren St
- 155 Walker St
- 157 Walker St
- 153 Throop St
- 157 Throop St